![]()


![]()

Shelter and Safety Net Services
Report Back to the Board of Supervisors
Table of Contents
I. Introduction and Background 5
II. San Mateo County Demographics 13
Diversity and Regional Characteristics 13
Housing Market and Foreclosures 14
Number on Public Assistance 15
Number of Individuals and Families Served by Core Service Agencies 15
III. Inventory of Shelter and Safety Net Services 22
V. Conclusion and Key Highlights 40
Appendix A: Inventory of Safety Net Services in San Mateo County 45
Appendix B: Copy of the Shelter and Safety Net Survey 66
Appendix C: Prototype of the Handout to be Distributed at Homeless Census 2009 72
This report has been prepared by the Human Services Agency (HSA) to address issues raised by the Board of Supervisors at the September 2008 final budget hearings regarding the County’s shelter and safety net services.
Demographics
San Mateo County has a very diverse population with 720,000 residents, 33% of whom are foreign born. Residents also speak a variety of languages including Spanish, Cantonese, Mandarin, Tagalog, Tongan, Samoan, Burmese, Vietnamese, Russian, French, Italian, German, Hungarian, Farsi, Tamil, Hindi, Fijian, Punjabi, Turkish and Gujarati. The county's unemployment rate has increased by 30% from last year's 3.8% to 5.4% as of October 2008. This is likely an indication of future service needs of our county residents. The county is also suffering from the impact of the national housing crisis. The median single family home price in San Mateo County has dropped by 17% to $777,777 and home sales dropped by 4.9%. Daly City has the highest foreclosure rate in the county at 11.9 foreclosed homes per 1,000 homes. The need for affordable housing puts more pressure on the Section 8 federal housing program. The latest round of openings for 3,600 Section 8 vouchers yielded 23,000 applicants. A total of 26,676 individuals, comprising 9,664 families, accessed the seven Core Service Agencies in the past year. Fair Oaks Community Center and Samaritan House served nearly 50% of the clients. As reported through Core Service Agency Reports and the Shelter and Safety Net Survey, the largest identified need by individuals and families were food and housing.
Inventory of Shelter and Safety Net Services
Since FY1976, San Mateo County has partnered with seven Core Service Agencies to provide an array of emergency assistance and services to those in need. These agencies and shelters are spread across the county in order to ensure as many communities as possible have access to these services. Below are tables listing the various partners with whom HSA contracts.
Core Service Agency |
Location |
Areas Served |
Coastside Hope |
El Granada |
Montara, Moss Beach, El Granda, Half Moon Bay, La Honda, and Pescadero |
Daly City Community Services Center |
Daly City |
Daly City, Colma, Broadmoor |
Fair Oaks Community Center |
Redwood City |
Redwood City, North Fair Oaks, Atherton, Woodside and Portola Valley |
North Peninsula Neighborhood Services Center |
South San Francisco |
South San Francisco, San Bruno, and Brisbane |
Tides/Pacifica Resource Center |
Pacifica |
Pacifica |
Samaritan House |
San Mateo |
Millbrae, Burlingame, Hillsborough, San Mateo, Foster City, Belmont, and San Carlos |
El Concilio of San Mateo County |
East Palo Alto |
East Palo Alto and Menlo Park |
Shelter Provider Name |
Location |
InnVision |
Menlo Park |
Interfaith Hospitality Network |
Burlingame |
Safe Harbor Shelter |
South San Francisco |
Shelter Network – Maple Street Shelter |
Redwood City |
Shelter Network - Family Crossroads |
Daly City |
Shelter Network - Redwood Family House |
Redwood City |
Shelter Network - Haven Family House |
Menlo Park |
Shelter Network - First Step for Families |
San Mateo |
Community Overcoming Relationship Abuse (CORA) |
San Mateo |
Youth and Family Enrichment Services (YFES)/ Daybreak for Youth |
Redwood City |
Service League – Hope House |
Redwood City |
Safety Net Provider Name |
Office Location |
Human Investment Project (HIP) Housing |
San Mateo |
Legal Aid Society |
San Mateo |
Shelter Network - Motel Vouchers |
Various Locations |
Second Harvest Food Bank |
San Carlos |
Bay Area Legal Aid |
San Mateo |
Samaritan House – Case Manager |
San Mateo |
Community Legal Services of East Palo Alto |
East Palo Alto |
Data Analysis
The online Shelter and Safety Net survey was sent to eighteen service providers which currently have at least one active contract with HSA. All service providers responded with seven identified as Core Service Agencies. Core Service Agencies provide individuals and families with much needed support to stabilize their living situations, their main service being information and referral. HSA has been funding the Core Service Agencies through the County General Fund since 1976. Shelter Network serves as the most frequently cited resource for individual client and family referrals regarding housing followed by Core Service Agencies.
The survey indicates that the highest met need for individuals were food assistance with 99% of clients receiving services. This is followed by transitional housing with 88% of clients receiving services and lastly, emergency shelter with 69% of clients receiving services. These numbers regarding housing needs met are not confirmed as there has not been consistent data entry using the same terminology for ‘needs met’. Service providers face the apparent lack of emergency and transitional bed capacity for individuals and families. They have few options to suggest when shelters are full. The survey also reveals that in every area except Pacifica, there is a higher proportion of Hispanics seeking housing services from Core Service Agencies. Most clients who seek housing on the coast have been homeless for over a year while those who seek housing from Fair Oaks Community Center and Samaritan House report experiencing more than one episode of homelessness. Clients who seek services from Core Service Agencies are most likely to be families or females between the ages of 18-54 while those who seek emergency and transitional shelters throughout the county are most likely to be a white male, aged 41-64 with a last known address in Redwood City.
According to the FY 2007-08 Quarterly Contract Services Reports from Core Service Agencies, 100% of clients who sought food received food assistance, while 74% of clients who sought housing had their needs met. These ranged from receiving information or referral assistance to shelter referrals. Most individuals and families served earn less than $25,000 annually. Both requests for housing and shelter services are experiencing double digit increases in demand. The 2007 One Day Census results confirm that a large majority of homeless persons in San Mateo County are disabled. Of those surveyed, 72% reported that they had at least one disability. It also found that 27% of survey respondents have veteran status. Despite the large numbers of homeless people with disabilities and no employment, 36% of them receive no government benefits. Data further shows that there are service gaps in the system, one of which is matching client needs to services that could alleviate the client's situation. For example, while 80% of homeless people surveyed were unemployed, only 12% of them reported using job training services. Furthermore, about 27% of those surveyed were veterans but only 10% reported receiving veteran's benefits.
This report recognizes that there are multiple service gaps that need immediate attention particularly in areas regarding service availability limitations, special populations, funding and geographical disproportionality.
• The need for shelter and safety net services has rapidly risen as the economic downturn continues.
• Challenges remain in access to services:
o The general public continues to experience confusion regarding how to access shelter and safety net services.
o South Coast area residents, due to proximity, are unable to access the existing Core Service Agency in El Granada. Residents are currently supported by a small community-based organization (Puente de la Costa Sur) with minimal funding from HSA.
o There is a need to link homeless individuals to services offered during the day.
o Few county-funded services are available seven days a week
o Services may not be accessible to clients who most need them due to transportation barriers
• Collaboration and Coordination must continue:
o There is a need to collaborate with faith-based providers to increase service accessibility, particularly to clients who are not served by the Core Service Agencies
o There is a need to more closely collaborate across county departments around the coordinated delivery of shelter and safety net services.
• Funding remains a challenge at federal, state, and county levels as a result of the recent economic downturn.
• Service providers are impacted due to budgetary constraints faced by government agencies and grant providers
• There is increased risk due to the potential loss of emergency shelter beds due to the loss of lease at the Menlo Park VA campus (112 shelter beds), which serves both San Mateo and Santa Clara County residents.
Recommendations
Based on the conclusions set forth in this report, the recommendations are as follows:
A. Increase Access to Services
• Fund the placement of homeless benefits liaisons at homeless shelters to increase enrollment of eligible individuals in public assistance programs.
• Expand HOT teams to additional areas within the county.
• Conduct an additional homeless veteran stand-down event to connect them with veterans and homeless services – Fall 2009.
B. Increase/Sustain Capacity of Shelter and Safety Net Services
• Fund Puente de la Costa Sur as a Core Service Agency serving South Coast residents.
• Fund a seasonal warming shelter in East Palo Alto.
• Support HOPE/IAC report recommendations to sustain shelter beds at current capacity by identifying an alternate, in-county shelter location that replaces Clara-Mateo.
• Residents that currently occupy daytime shelter services should be served by an existing community based service.
C. Facilitate Collaboration:
• Convene a homeless summit in the spring 2009 to specifically address the results of the one-day homeless census.
• Convene quarterly meetings with faith-based, CBOs, foundations, and volunteer organizations to strengthen community partnerships.
D. Monitor Performance Outcomes:
• Develop a continuous quality improvement plan and a system for reporting out on a quarterly basis.
• Publish a Bi-Annual Safety Net Report Card.
I. Introduction and Background
The County of San Mateo has long recognized the importance of a reliable safety net system for our county’s most vulnerable residents – individuals and families in need. Having a comprehensive social safety net, a collection of services which prevent individuals from falling into poverty beyond a certain level, helps to ensure that the basic needs of county residents are met. The San Mateo County Human Services Agency’s (HSA) Prevention and Early Intervention Division oversees Shelter and Safety Net Services, provided through contracts with community based organizations. One HSA program, the Center on Homelessness (COH), coordinates the provision of homeless and safety net services throughout the County, administers the County's Homeless Continuum of Care, creates and monitors contracts with Non-profit and Community Based Organizations (CBOs) and supports resources to assist homeless individuals and families in securing shelter and attaining self-sufficiency.
In the past several years, there have been a variety of efforts to assess the need for safety net services throughout the county. From these efforts both short and long term strategies were developed in order to meet the needs of individuals and families who seek services from our safety net system. One primary goal in the Human Services Agency’s Strategic Plan for 2008-2013 for Prevention and Early Intervention Services is to foster community well-being and integration of services by building on the strengths of targeted communities and ensuring that HSA consumers have their basic needs met and can thrive in their own communities. Additionally, HOPE (Housing Our People Effectively), the County’s 10 Year Plan to prevent and end homelessness, calls for delivering timely and effective services to support stability and independence for individuals and families.
Human Services Agency Safety Net Services
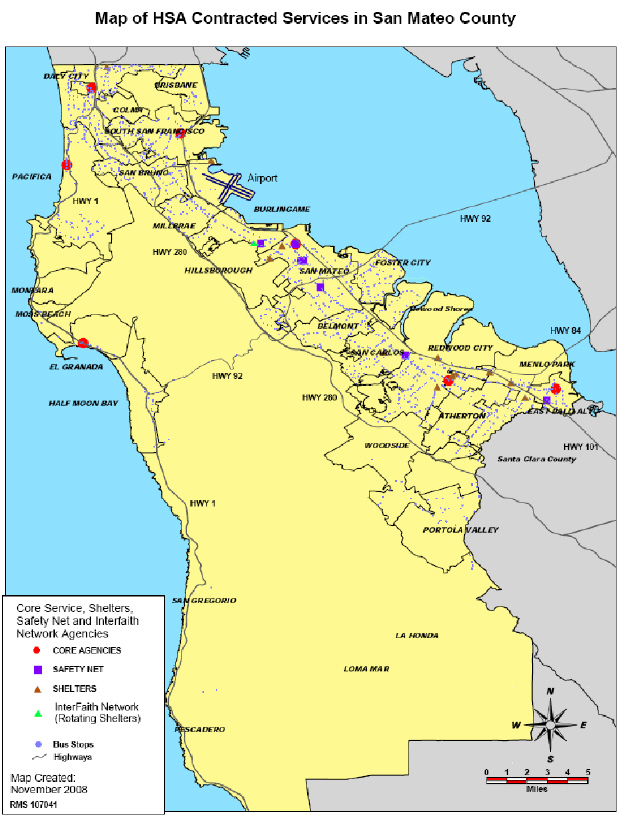
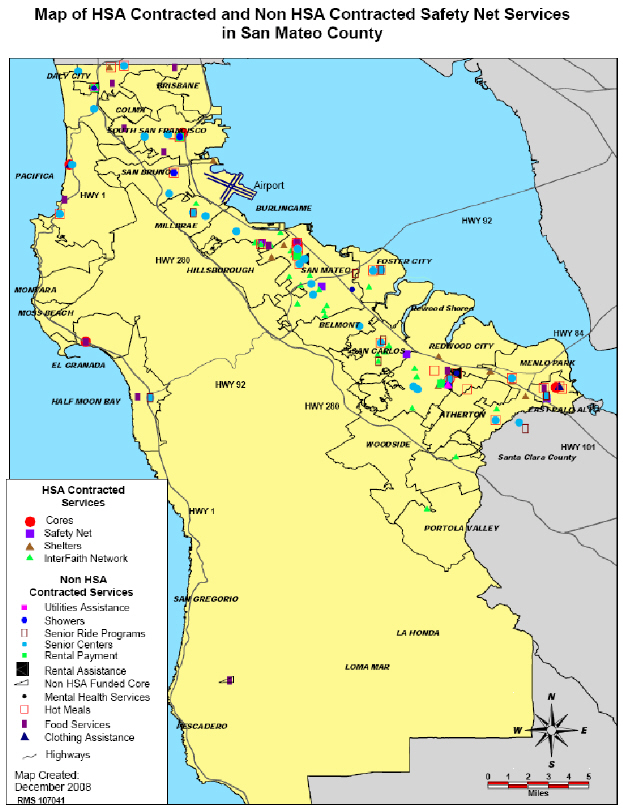
Safety Net Services funded by the Human Services Agency are comprised of three categories of service providers; Core Service Agencies, Shelters, and Safety Net Services, all of whom work closely together to create a provider network for our county residents. In FY 2007-2008, the Human Services Agency served 132,708 unique clients across all agency programs.
![]()


*Refer to the map entitled “Map of Core Agencies, Shelters and Safety Net Providers” for a visual display of HSA-funded services offered in the county.
Core Service Agencies
There are seven Core Service Agencies (CSAs) who work in close collaboration with the Human Services Agency to provide individuals and families much needed support to stabilize their living situations. Currently, HSA contracts with seven CSAs (see Section III, page 22, for detailed information regarding these contracts). These agencies provide general information and referral services to resources in the community, emergency assistance in the form of food, clothing and shelter, employment information and short-term case management. The CSAs also have the ability to provide or help locate food, clothing, shelter, rental assistance, bus passes and referrals for other needs on an emergency basis. Clients are provided counseling, crisis intervention, and referrals based on an evaluation of their needs and qualifications for assistance.
Core Service Agencies are located throughout the county and serve the following areas indicated below.
Core Service Agency |
Location |
Areas Served |
Coastside Hope |
El Granada |
Montara, Moss Beach, El Granda, Half Moon Bay, La Honda, and Pescadero |
Daly City Community Services Center |
Daly City |
Daly City, Colma, Broadmoor |
Fair Oaks Community Center |
Redwood City |
Redwood City, North Fair Oaks, Atherton, Woodside and Portola Valley |
North Peninsula Neighborhood Services Center |
South San Francisco |
South San Francisco, San Bruno, and Brisbane |
Tides/Pacifica Resource Center |
Pacifica |
Pacifica |
Samaritan House |
San Mateo |
Millbrae, Burlingame, Hillsborough, San Mateo, Foster City, Belmont, and San Carlos |
El Concilio of San Mateo County |
East Palo Alto |
East Palo Alto and Menlo Park |
Emergency and Transitional Housing Shelters
San Mateo County maintains both emergency and transitional shelter beds located countywide. These temporary housing options have multiple funding streams including the County General Fund, the Housing and Urban Development (HUD) Continuum of Care, and Community Development Block Grants. The Inventory of Services List in Section III of this report provides a more detailed view of provider services and their locations.
Shelter Provider Name |
Location |
InnVision |
Menlo Park |
Interfaith Hospitality Network |
Burlingame |
Safe Harbor Shelter (Samaritan House) |
South San Francisco |
Shelter Network – Maple Street Shelter |
Redwood City |
Shelter Network - Family Crossroads |
Daly City |
Shelter Network - Redwood Family House |
Redwood City |
Shelter Network - Haven Family House |
Menlo Park |
Shelter Network - First Step for Families |
San Mateo |
Community Overcoming Relationship Abuse (CORA) |
San Mateo |
Youth and Family Enrichment Services (YFES)/ Daybreak for Youth |
Redwood City |
Service League – Hope House |
Redwood City |
Safety Net Services
Safety Net services are provided county-wide, serving all areas of the county with their office locations displayed below. The services funded by HSA include motel vouchers administered by Shelter Network, housing assistance, referral and linkage services by (Human Investment Project) HIP Housing, emergency food by Second Harvest Food Bank, case management by Samaritan House, and legal services by the Legal Aid Society, Bay Area Legal Aid, and Community Legal Services in East Palo Alto.
Provider Name |
Office Location |
Human Investment Project (HIP) Housing |
San Mateo |
Legal Aid Society |
San Mateo |
Shelter Network - Motel Vouchers |
Various Locations |
Second Harvest Food Bank |
San Carlos |
Bay Area Legal Aid |
San Mateo |
Samaritan House – Case Manager |
San Mateo |
Community Legal Services of East Palo Alto |
East Palo Alto |
Non-Contracted Safety Net Network
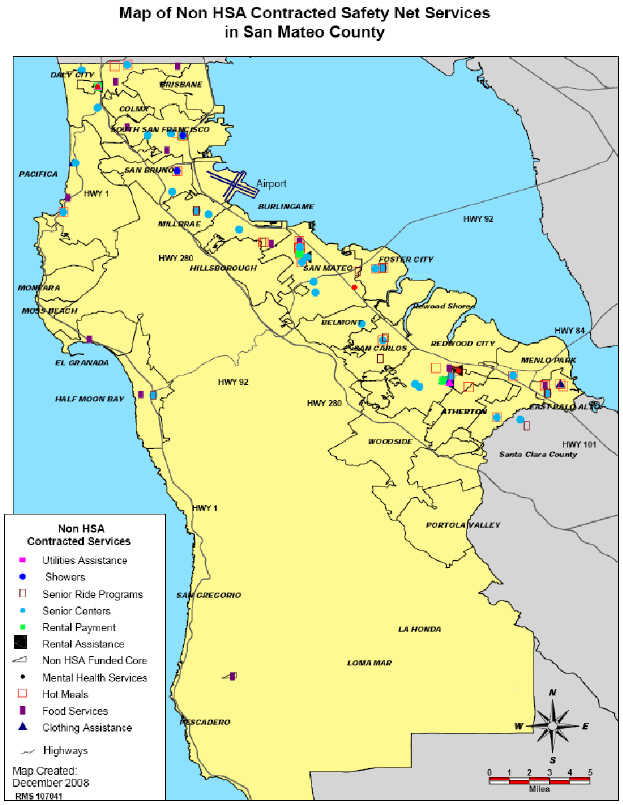
In addition, the county contains a wide web of non-HSA contracted service providers who provide essential services as part of the county’s safety net system. A complete inventory is included in Appendix A: Inventory of Safety Net Services in San Mateo County.
There is recognition of the need for HSA to collaborate with more non-contracted entities. The organizations providing these services may receive funding from other county departments. The services provided include community centers, senior centers, clinics, adult activity centers, nutrition programs, park and recreation departments, transportation services, dining rooms, and a mobile health van. Specific organizations may provide services in different languages to meet the needs of a particular community.
Congregational Communities
Congregational communities are one group that is important to the county’s safety net and have been providing these services for many years. While San Mateo County contains a large number of congregational communities, HSA has a direct contractual relationship with only one, the Interfaith Hospitality Network (IHN) of San Mateo. IHN, whose services primarily cover the central region of San Mateo County (San Mateo, Burlingame, San Carlos, Redwood City, Millbrae), provides emergency (60 day) shelter and three meals daily to three to five homeless families with children (up to 15 people at a time). The IHN model is to rotate their emergency shelter through different congregations in the county.
This Shelter and Safety Net Report was prepared in December 2008 to address the questions raised by the Board of Supervisors in September. Updates have been added to the report since that date. The intent of this report is to address the current network of services as well as closely examine the needs and day services received by individuals and families seeking safety net services. This report provides new information on the network and activities of the county’s Core Service Agencies, existing emergency and transitional shelters, an updated inventory of shelter and safety net services in the county, and the funding allocations towards these services.
While this report is not intended to provide comprehensive solutions, recommendations are included on how a more coordinated approach can be provided. This report was an objective program and data review intended to further conversations on how the county might address issues facing individuals and families in need who are seeking safety net services.
The methodology used for the Shelter and Safety Net report was as follows:
• Reviewed previous needs assessments, census counts, reports, and plans related to homeless and safety net services in San Mateo County.
• Conducted a new survey of providers funded by the Human Services Agency in October 2008 to gather information on funding, capacity, services, client needs, and referrals.
• Reviewed current contracts held by the Human Services Agency which provide safety net services.
• Conducted data analysis on the Homeless Management Information System to develop a client profile for the county, and for those served by individual providers
• Verified the current availability of services provided by agencies who are listed in the “Survival in San Mateo County, A Guide to Resources for the Homeless or People in Need” guide created in 2004 (Currently out of print).
• Integrated several data sources to develop a more comprehensive, updated inventory of homeless services.
• Reviewed data reports submitted from the Core Service Agencies in order to assess capacity of services.
The data sources utilized for this report included the following:
Shelter and Safety Net Survey
In October 2008, an online electronic survey was conducted with eighteen organizations in San Mateo County who currently have an active contract with the Human Services Agency. See Appendix B for a list of the participating providers. The purpose of the survey was to collect new and updated information on clients, program and services being provided, agency budget, referral patterns, and additional resources. The data received via the surveys provided a snapshot of the current need faced by our safety net providers.
Core Service Agency Reports
The Human Services Agency maintains contracts with seven Core Services Agencies to provide a broad range of services and resources to low-income residents in San Mateo County. Services may include, case management, clothing, medical care, food, referrals to and/or shelter, employment assistance, and food and toys for the holidays. All services are provided free of charge to low-income families. The community service agencies can provide or help locate emergency food, clothing, shelter, rental assistance, bus passes and referrals for other needs. Services being provided are reported as part of the Human Services Agency’s Outcome Based Management (OBM) reporting to the County Manager’s Office. On a quarterly basis, each Core Service Agency submits a data report to HSA that includes quantitative data on the number and type of clients who seek and receive food, housing, and other emergency services.
HOPE Plan: San Mateo County’s Ten Year Plan to End Homelessness
The Housing Our People Effectively (HOPE) Plan: San Mateo County’s Ten Year Plan to End Homelessness was adopted in March 2006 and is a call to action for the San Mateo County community to prevent and end homelessness in ten years. In April 2005, the HOPE Plan was initiated and developed with the San Mateo community under leadership from Supervisors Jerry Hill and Mark Church. The HOPE Plan was adopted to set into motion a ten-year plan of action to change the way the community works together to prevent and end homelessness in our county This plan addresses the lack of affordable and permanent supportive housing and focuses on long term solutions to homelessness.
The recommendations included in the HOPE Plan are as follows:
a. Increase housing opportunities for people who are homeless or at imminent risk of homelessness.
b. Prevent and end homelessness by delivering timely, flexible services to support stability and independence.
c. Create system performance standards, track progress towards ending and preventing homelessness, and report results to stakeholders and the broader community.
d. Develop long-term leadership and community will to prevent and end homelessness.
HOPE Plan Recommendations Regarding Homeless Shelters
While the HOPE Plan does not recommend expansion of the emergency shelter system, it recognizes the importance of the existing inventory of emergency shelter and transitional housing. These facilities not only address the immediate and short-term housing needs of homeless individuals and families but also provide essential services, including health, behavioral health, and vocational services. One of the premises of the HOPE plan is that emergency shelter and transitional housing beds will continue to be needed until such time as an adequate supply of supportive housing has been created.
The Interagency Council (IAC) oversees the implementation of the HOPE Plan. As a follow up action item in the report back to the Board of Supervisors regarding Network of Shelter Services, it was stated that the IAC would develop a recommendation regarding ‘including homeless shelters in the scope of the HOPE Plan’. The IAC met on November 12, 2008 and a subcommittee presented the below recommendations which were adopted by the IAC:
1. Reaffirm the need to sustain the existing inventory of emergency shelter and transitional housing;
2. Not become involved in the operational details about how best to sustain the existing system of homeless shelters and transitional housing;
3. Not take a position in regards to increased funding for any particular shelter or transitional housing program and refer questions about the sustainability of shelter providers back to the HOPE stakeholders who fund, operate, or oversee the emergency shelter system in the county (including the Board of Supervisors and appropriate County agencies) for further analysis and decision-making.
The above recommendations do not address the related issue of whether or not the existing emergency shelter and transitional housing system currently has adequate capacity to meet community needs. This is an issue that would fall within the scope of the HOPE Plan. Undertaking an analysis of current system capacity and unmet need for emergency shelter and transitional housing and making recommendations about whether to expand the capacity of these programs would be an appropriate role for the HOPE IAC.
San Mateo County Homeless Census and Survey, 2007
The census, a one-day count of homeless persons in the county found that on January 30, 2007, there were 2,064 homeless people. This included 1,094 homeless (unsheltered) individuals and 970 sheltered homeless people comprising 693 households. Unsheltered is defined as living in a place not meant for human habitation, while sheltered means living in an emergency shelter or in transitional housing. The street census was supplemented by a survey of 422 homeless people using a two-page questionnaire designed to elicit information from respondents about who they are (demographic information, disability, veteran status, etc.), why they became homeless and what they need to end their homelessness. Additionally, it is estimated that 6,646 persons in San Mateo County experience homelessness each year.
Homeless Management Information System (HMIS) Data
Shelter providers funded by the U. S. Department of Housing and Urban Development (HUD) are required to enter client demographic data and shelter usage data into a Homeless Management Information System (HMIS), which is a software application designed to record and store client-level information on the characteristics and service needs of homeless persons. HMIS is a web-based software application that homeless assistance providers use to coordinate care, manage their operations, and better serve their clients. An HMIS knits together homeless assistance providers within a community and creates a more coordinated and effective housing and service delivery system. HUD and other planners and policymakers at the federal, state and local levels use aggregate HMIS data to obtain better information about the extent and nature of homelessness over time. In the near future, HMIS will be used to produce an unduplicated count of homeless persons, understand patterns of service use, and measure the effectiveness of homeless programs.
A Community Assessment: Strengthening the Safety Net for San Mateo County’s Neediest Residents In 2005, HSA commissioned Applied Survey Research (ASR), a nonprofit social research firm, to conduct a needs assessment whose research focused purely on the needs of county residents and the service, access, and system gaps that prevent optimal delivery of Safety Net services. The data collected included conducting individual interviews with 140 needy San Mateo County residents and facilitating seven focus groups of Safety Net service providers. A Safety Net Project Workgroup, composed of representatives from the Core Service Agencies, Community-Based Organizations, and HSA staff, provided feedback and reviewed project materials and findings at several points throughout the research process.
II. San Mateo County Demographics
Diversity and Regional Characteristics
San Mateo County has a diverse population, which includes over 720,000 residents who speak a variety of languages including Spanish, Tagalog, Tongan, Samoan, Burmese, Mandarin, Cantonese, Vietnamese, Russian, French, Italian, German, Hungarian, Farsi, Tamil, Hindi, Fijian, Punjabi, Turkish, and Gujarati.
A language telephone line is also available to clients for other languages not spoken at an HSA office. Based on the 2006 American Community Survey, which is conducted by the United States Census Bureau, the County of San Mateo is a highly diverse community:
§ 33% of residents are foreign born
§ 44% of households speak a language other than English in the home
§ 46% of residents identify as non-Hispanic whites
§ 23% identify as Hispanic or Latino
§ 23% identify as Asian
§ 3% identify as African American or Black
San Mateo County is comprised of multiple geographic and cultural communities, each with their own unique characteristics. One of our most diverse communities is East Palo Alto, which is home to approximately one quarter of the county’s African American, Native Hawaiian and Pacific Islander populations, while one third of Daly City’s 100,000 residents are of Filipino origin.
San Mateo County is also diverse economically. The Town of Atherton has a median annual household income of $200,000 while the similarly sized Town of Colma has a median annual household income of just under $60,000.
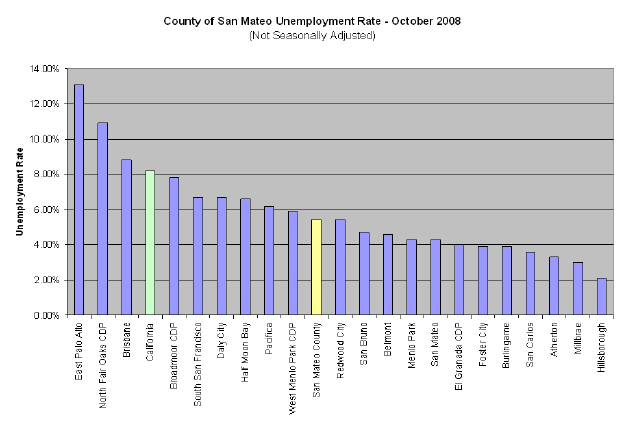
Unemployment estimates from the United States Bureau of Labor Statistics for October 2008, places the county’s unemployment rate at 5.4%, representing a 30% increase from the 3.8% rate in October 2007. The increase in unemployment is likely an indication of future service needs of our county residents, who may turn to the county’s safety net in order to get their basic needs met. Recent anecdotal data from county Core Service Agencies supports this.
The graph below shows the relative unemployment rates for cities across San Mateo County. While the county average unemployment rate of 5.4% is well below the state average of 8.2%, there are several cities and localities (East Palo Alto, North Fair Oaks, and Brisbane) that are experiencing rates well above the state average.
Declining home prices have been pervasive across California - San Mateo County included. Compared to September 2007 data collected by the San Mateo County Department of Housing, the median single family home price in San Mateo County has dropped by 17% to $777,777. Over the last year, home sales dropped 4.9%. As of the third quarter of 2008, Daly City has the highest foreclosure rate in the county at 11.9 foreclosed homes out of 1,000 homes. This is followed by Redwood City at 11 foreclosed homes per 1,000 homes. San Mateo County is ranked 36th out of 58 in a list of California counties' national foreclosure rates.
An immediate effect of increasing home foreclosure rates in the county is a jump in the number of people in need of affordable housing. As more and more people apply for affordable housing developments within the county, pressure increases on the Section 8 federal housing program. It becomes more difficult for extremely low income individuals and families to find affordable rental units. The latest round of openings for 3,600 Section 8 vouchers yielded 23,000 applicants.
Those who can afford to are looking for apartments, although rents are also increasing because of high demand. First quarter FY08-09 data from the County of San Mateo Department of Housing indicates that the market average rental price for a one bedroom apartment in the county has risen 5.4% to $1631 when compared to the same period last year.
In November 2008, the number of new applicants applying for public assistance, and the monthly number of cases with a year to year comparison are displayed in the table below:
Program |
Number of New Applications Received |
Percent Change in One Year |
Number of Ongoing Cases |
Percent Change in One Year | ||
Nov-2007 |
Nov-2008 |
Nov-2007 |
Nov-2008 | |||
CalWORKs |
332 |
320 |
-3.61% |
2,141 |
2,341 |
+9.34% |
Medi-Cal only |
1,784 |
1,671 |
-6.33% |
28,679 |
29,236 |
+1.94% |
General Assistance |
294 |
299 |
+1.70% |
478 |
517 |
+8.16% |
Food Stamps |
776 |
817 |
+5.28% |
4,017 |
5,003 |
+24.55% |
The data shows that the number of ongoing public assistance cases, across all aid programs, have increased in the past year. The largest percentage change is in Food Stamp ongoing cases, with an increase of almost 1,000 more cases in the past year, as a result of the agency’s extended outreach efforts to individuals and families who are eligible.
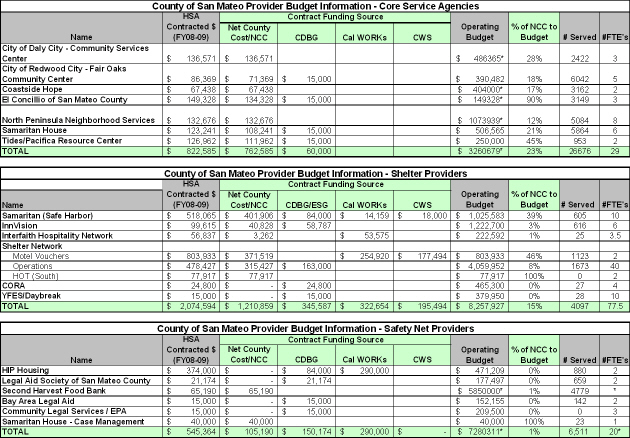
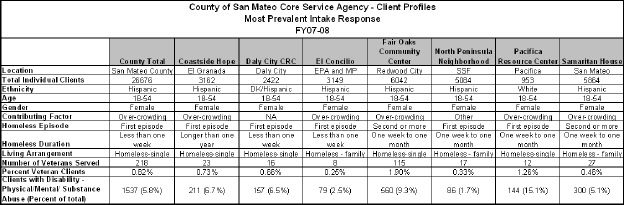
Information reported by the seven Core Service Agencies shows the unduplicated number of individuals and families served during FY2007-08, as shown in the figure below.
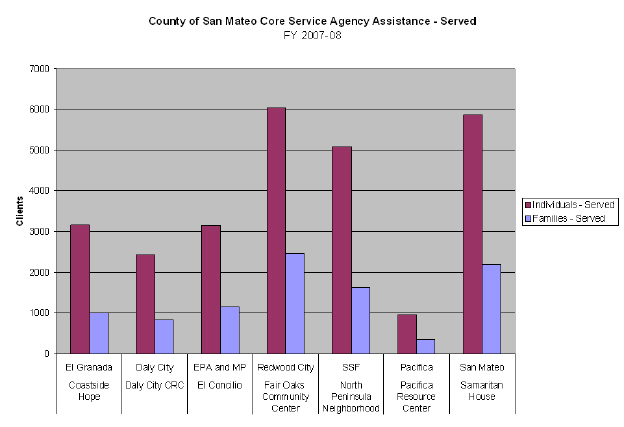
Source: Cores OBM Reporting (FY2007-2008)
In FY 2007-2008, the Core Service Agencies reported that they served a total of 26,676 individuals, of which 9,664 families were included. The table below displays the total number served based on the current reporting mechanism utilized by the Core Service Agencies:
Core Service Agency |
Individuals |
Families |
Coastside Hope |
3,162 |
1,013 |
Daly City Community Services Center |
2,422 |
842 |
Fair Oaks Community Center |
6,042 |
2,466 |
North Peninsula Neighborhood Services Center |
5,084 |
1,632 |
Tides/Pacifica Resource Center |
953 |
356 |
Samaritan House |
5,864 |
2,202 |
El Concilio of San Mateo County |
3,149 |
1,153 |
Core Service Agency Totals |
26,676 |
9,664 |
Source: Cores OBM Reporting (FY2007-2008)
The data shows that nearly 50% of clients were served by two agencies: Fair Oaks Community Center (23%) and Samaritan House (23%). As reported through the Core Agency Reports and the Shelter and Safety Net Survey, the largest identified need by individuals and families was food and housing.
There is inconsistency in data received about the number of individuals and families served in shelters. In FY 07-08, data submitted by the providers report 4,117 individuals and 908 families served, while data from the Homeless Management Information System (HMIS) shows that 2,466 individuals and 386 families were served in homeless shelters.
Reports of Actuals to HSA |
Data in HMIS | ||||
Shelter Provider Name |
Location |
Individuals Served |
Families Served |
Individuals Served |
Families* Served |
InnVision |
Menlo Park |
616 |
112 |
222 |
3 |
Interfaith Hospitality Network |
Burlingame |
0 |
25 |
34 |
6 |
Safe Harbor Shelter |
South San Francisco |
605 |
0 |
370 |
0 |
Shelter Network – Motel Voucher Program (MVP) |
Various |
1123 |
339 |
690 |
186 |
Shelter Network – Maple Street Shelter |
Redwood City |
286 |
0 |
413 |
0 |
Shelter Network - Family Cross Roads |
Daly City |
170 |
50 |
163 |
47 |
Shelter Network - Redwood Family House |
Redwood City |
115 |
36 |
124 |
35 |
Shelter Network - Haven Family House |
Menlo Park |
253 |
65 |
199 |
49 |
Shelter Network - First Step for Families |
San Mateo |
849 |
268 |
235 |
64 |
Community Overcoming Relationship Abuse (CORA) |
San Mateo |
27 |
13 |
-- |
-- |
Youth and Family Enrichment Services (YFES) |
San Carlos |
28 |
0 |
-- |
-- |
Service League – Hope House* |
Redwood City |
45 |
0 |
16 |
0 |
Total |
4,117 |
908 |
2,466 |
386 | |
* Service League not contracted for FY2008-09
* In HMIS, “Family” is defined as a household composed of two or more persons, at least one of who is a child accompanied by an adult or a juvenile parent.
On October 31, 2008, an online survey was sent to eighteen service organizations/agencies within San Mateo County who currently have at least one contract with the Human Services Agency to provide safety net and/or shelter services. A copy of the survey with a list of respondents is included with this report as Appendix B.
Eighteen agencies responded to the survey; of those, seven are defined as Core Service Agencies. Other types of agencies included in this survey were categorized as an emergency or transitional shelter site, Safety Net agency, food distribution site, and ‘other’ service provider. The annual operating budget in these agencies ranged from $245,000 to $16.6 million, and the sources and allocation of funding varied considerably across organization.
The types of services available to clients include emergency food, emergency shelter, transitional housing, clothing, rental assistance, and bus passes among other services. The agencies that identified rental assistance as a service available to clients indicated a subsidy amount ranging from $400 to $5000. Rental assistance/subsidies usually have a one-time only limit but some agencies indicated that individual circumstances are considered if a repeat request is made.
Of the eighteen agencies, fourteen provide case management services ranging from less than 30 days to over 9 months. The number of individual clients served varied widely and often depended on the resources of the organization and nature of services delivered. For example, a relatively small organization, Interfaith Hospitality Network, provided shelter services to 96 clients (25 families) in the fiscal year 2007-2008 while Bay Area Legal Aid provided legal assistance to 70,000 clients during the same fiscal year, primarily through telephone contact.
II. Survey Findings
Shelter Resources for Individuals:
Of the 18 CBOs who answered the question: “Where do you refer individual clients for emergency shelter services?”, the most common response was Shelter Network followed by Core Service Agencies and Safe Harbor. St. Vincent de Paul, CORA, and InnVision were also noted among agencies chosen as a first choice option for emergency shelter services. Shelter Network, Safe Harbor, and InnVision were chosen as a frequent second choice option for service providers when referring clients for shelter. Also mentioned as a second choice option were Palm Avenue (a 15-bed detoxification program in San Mateo), and the Homeless Assistance Program for Veterans. InnVision, St. Bruno’s Church, Fair Oaks Community Center, and Shelter Bed Hotline (a toll-free hotline which searches emergency shelters in Northern California, 1-800-774-3583) were noted as a third or fourth option. A few service providers noted that they refer clients out of county and one agency noted that clients are urged to consider friends and family as a latter option. When examining survey responses it was clear that service providers first seek to maximize bed usage amongst the County pool of services before resorting to other options such as out of county referrals.
When shelters reach capacity, service providers alternatively issue motel vouchers or refer individuals to the agencies mentioned above. Women’s Recovery Association, a women’s substance abuse treatment facility, and the Safe Network (domestic violence online directory listing) were two additional agencies noted as an alternative shelter resource for individuals.
Shelter Resources for Families:
The first and most frequently cited resource for service providers when referring families was Shelter Network. Core Service Agencies were also noted as a first choice option but to a lesser extent. Interfaith Hospitality Network and InnVision were cited more frequently as a second choice option by service providers while one agency noted that they encourage clients to utilize their support network. Again, St. Bruno’s Church and out of county resources was noted as an available but latter option.
When family shelters reach capacity, the majority of service providers indicate that they refer to the safety net providers for motel vouchers. They also refer families to the previously mentioned agencies, make out of county referrals, and one agency encourages families to utilize their support network.
Shelter Day Usage and Services:
During the day, clients who are employed or attending school or other training may leave to attend their respective activities. Others may attend day centers, such as the Elsa Segovia Day Drop-In Program for families (operated by InnVision on the VA campus in Menlo Park). Some shelters require clients to develop a plan to secure employment or disability benefits. Clients with income may also be required to set up a program to save money for housing and utility deposits. Clients may also go to PeninsulaWorks/JobTrain, the Opportunity Center in Palo Alto (day center for homeless individuals), employment agencies, outpatient treatment, or to other day services in the area. Typical reasons why clients might remain at the shelter during the day may be related to mental health issues, disabilities, counseling, case management, on-site treatment for substance abuse, life skills training, time off from work, children’s activities, job or housing searches, resume preparation, and meetings with service providers.
Needs and Service Gaps:
When examining the difference between the number of individuals who sought services for food assistance, transitional housing, and emergency shelter versus those who actually received services, some disparities were observed. The survey indicates that the highest met need for individuals were, in ranking order:
• Food assistance with 99% of clients receiving services
• Transitional housing ( typically 30 day to 12 month stay)with 88% of clients receiving services; and
• Emergency shelter (typically 30 day stay) with 69% of clients receiving services.
These findings are generally consistent with the 2007-2008 Core OBM Report.
Service Provider Comments:
The end of the survey included a narrative section where service providers were given the option to make additional comments. One common theme apparent among service providers was the lack of bed capacity. Specifically, Shelter Network commented that they have seen a dramatic increase in the number of families on their waiting list in the last few months; from 40-50 families last year to 75-110 families this year. Coastside Hope, located in El Granada, commented that they would like to see more shelter beds and possibly an additional shelter on the Coastside because it is difficult for families and individuals to access the shelter on the other side of the hill due to transportation issues, especially if the family is working locally. Pacifica Resource Center commented that there are few options to suggest when shelters are full. Clients often do have resources such as family but these resources may be inconvenient. Youth and Family Enrichment Services commented that their case managers refer individuals and families to all local area shelters, depending on their specific needs and circumstances. The Redwood City Core Service Agency/Fair Oaks Community Center commented that they need more emergency shelter space in the county. Options are extremely limited when there are no shelter beds available. Working with difficult to serve clients is particularly challenging because options are even more limited for these individuals. And finally, the Daly City Core Service Agency commented that housing is the number one issue in this county but there are not enough bed spaces to accommodate this need.
Although the scope of the survey was limited, it provided a snapshot of our contracted agencies, the services they provide and the clients they serve. While the survey highlights some service gaps and needs implications, it should, by no means, be viewed as a comprehensive barometer of the specific or emerging needs of the community as this was not its intent.
Issues faced by the Core Service Agencies
In 1976, the Core Service Agencies were created by the county to provide safety net services to low income families. Core Service Agencies were located in different regions within the county so that services could be tailored to local needs. The Human Services Agency contracts with the Core Service Agencies (CSA), located throughout the county, to provide safety net services, emergency food, and referral to shelter. However, as the graphs and table below illustrate, each CSA serves a different population demographic that brings with it a unique set of challenges. Most challenging, though, are clients that possess substance abuse issues, mental and/or physical disabilities. As a 1988 RAND study on homelessness in California noted:
Not surprisingly, the homeless with severe mental disorders have greater functional disability than other homeless. They are more likely to have trouble getting enough to eat and accomplishing simple tasks. They perceive themselves to be in poorer health. They are less likely to be married or working, and have been without steady jobs for a longer time. And although the homeless with and without mental disorders are predominantly male, the severely mentally disordered homeless are more likely to be women than are other homeless.1
As a function of their condition, these clients are less likely to seek and maintain state and federal benefits like General Assistance, Food Stamps, and Disability or may have difficulty complying with program mandated administrative requirements. It is also recognized that these clients may have complex needs including multiple presenting issues.
A summary of the specialized population served by the Core Agencies is shown below:
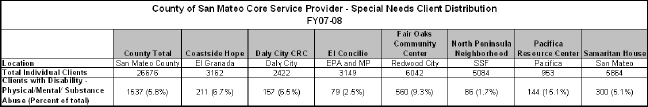
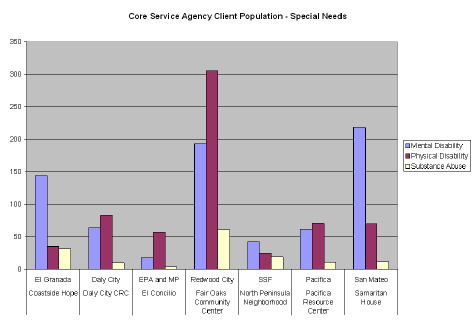
Source: Cores OBM Reporting (FY2007-2008)
Client Stories from Core Service Agencies
Below are a collection of brief vignettes shared by a few of HSA’s Core Service Agencies. These stories of client and service provider experiences shed light on some of the issues faced by both parties.
Coastside Hope
This Core Service Agency reports an increase in clients looking for housing as well as food.
Some recent stories of clients of Coastside Hope are shared below:
Housing is the hardest need to meet. Coastside Hope works with clients to secure safe shelter, but since there are no emergency shelters on Coastside, families and individuals need to be willing to go over the hill to access a shelter bed, otherwise they can access a motel voucher. If the individual or family is working locally and has no transportation it is a hardship to go over the hill. Also because of the increase in need for shelter there aren’t enough beds to meet the need even if an individual or family decides to go over the hill.
A family with two children ages 16 and 12, with both parents working. The place they rented for over a year was red tagged as an illegal unit. Even though both are working they could not find affordable housing and became homeless. The agency worked with them for a month to find them shelter. Finally an opening opened at IHN and they had safe shelter. While there, the family found permanent affordable housing in San Mateo and the agency was able to help with the deposit.
A senior couple lived at Pillar Ridge Mobile Home Park. The husband was hurt at work over a year ago and the wife also has health issues. Because of the reduction in income they couldn’t make the mortgage and their mobile home was foreclosed. They are now couch-surfing at their friends and family’s places. We have helped them put in applications for subsidized senior housing but the process is lengthy and is complicated by bad credit as a result of the foreclosure of their home.
Samaritan House
A recent story of Samaritan House helping clients is shared below:
Samaritan House recently encountered a family affected by the declining economy. The mother is a solo parent of six children. She had a job cleaning offices, and was laid off after the company she cleaned closed its business. Although she is actively seeking employment, she is having a difficult time finding work and making ends meet. She came to Samaritan House for help with food, rental assistance, clothing, and holiday assistance, and has also accessed services from Samaritan House medical and dental clinic.
Fair Oaks Community Center:
Aside from the increase in demand for services illustrated by the examples above, it is also important to note that homeless intervention and prevention services provided by the Core Service Agencies can be very complex and span over several months.
Some recent stories from Fair Oaks Community Center are shared below:
On Friday, November 14th, 164 families came to pick-up food at the monthly Family Harvest Food Distribution. The maximum number of families that Second Harvest Food Bank is able to serve at each Family Harvest Distribution is 134. Because of this, the agency will be working with Second Harvest Food Bank to determine how to serve the increased number of families in need.
John had been chronically homeless for several years. We first convinced him to come off the streets and consider going into shelter as a way towards ending his homelessness in November 2007. During the course of the last year, he entered our Early Entry Shelter Program, went into shelter, spent several months in the hospital, ended up back out on the street, came back into our Early Entry Shelter Program, went back into shelter, and has worked months on end to end his homelessness. During that course of time, our Human Services Specialists worked many hours over many weeks and months with him in conjunction with his case workers at the shelter addressing a substance abuse issue, sorting through the various benefits he was or was not eligible for, while keeping him on track and organized. Through these efforts, John was able to secure a Housing Plus voucher for subsidized housing, but the story didn’t end there. It took him several months to find an apartment that would accept him and his voucher – the rental market being as competitive and increasingly expensive as it is. After almost a year, John is finally moving into his own apartment this month. We are heartened by John’s ongoing efforts even when circumstances led him away from his goal. His success is reminder that you can’t always measure the success or impact of our work just in the numbers. It is the difference we can make in helping people change or improve their lives.
III. Inventory of Shelter and Safety Net Services
The introduction section of this report provided a brief summary of safety net services in San Mateo County, including those funded by the Human Services Agency (Core Service Agencies, Shelters, and Safety Net Services) and the wide web of non-HSA contracted service providers whom provide safety net services. This section includes a full description of HSA-funded services, with capacity and usage data, budget information where available, and an updated comprehensive inventory of non-HSA funded services which are available. Colored maps are included to provide a visual display of where services are provided county-wide.
Core Service Agencies
As a commitment to our county residents, Human Service Agency continues to contract and collaborate with the Core Service Agencies to provide safety net and shelter services to our many low-income needy residents. The Core Service Agencies provide individuals and families much needed support to stabilize their living situations. The agencies provide or help locate emergency food, clothing, shelter, rental assistance, bus passes and referrals for other needs. Clients are provided counseling, crisis intervention, and referrals based on an evaluation of their needs and qualifications for assistance.
It should be noted that the primary service provided by Core Service Agencies is information and referral. With the exception of one agency, Samaritan House, none directly provide shelter services. Before a client can receive shelter services from a “Shelter Provider”, a referral must be issued by one of the Core Agencies or St. Vincent de Paul. For purposes of data analysis, shelter clients are assumed as a subset of core clients.
Core Service Agencies are located throughout the county and serve the following city/county jurisdictions indicated below.
• Coastside Hope, 99 Avenue Alhambra, El Granada Serves Montara, Moss Beach, El Granada, Half Moon Bay, La Honda, and Pescadero.
• Daly City Community Services Center, 350 90th Street, 1st Floor, Daly City Serves Daly City, Colma, and Broadmoor.
• El Concilio of San Mateo County, 1798-B Bay Road, East Palo Alto Serves East Palo Alto and Menlo Park
• Fair Oaks Community Center, 2600 Middlefield Road, Redwood City Serves Redwood City, North Fair Oaks, Atherton, Woodside and Portola Valley.
• North Peninsula Neighborhood Services Center, 600 Linden Avenue, South San Francisco Serves South San Francisco, San Bruno, and Brisbane.
• Tides/Pacifica Resource Center, 1809 Palmetto Avenue, Pacifica, Serves Pacifica.
• Samaritan House, 401 North Humboldt Street, San Mateo, CA 94401. Serves Millbrae, Burlingame, Hillsborough, San Mateo, Foster City, Belmont, and San Carlos.
Budget Information
Since 1976 the County of San Mateo Human Services Agency has maintained contracts with the Core Service Agencies (CSAs) across the county for safety net services, including referrals to the shelters. These contracts are renewed annually and monitored through the Center on Homelessness. The Human Services Agency funded the seven CSAs through County General Fund since FY 1976-77 under the Office of Housing's operational budget.
The level of funding for each agency is determined by the HSA Fiscal Department through the regular annual budget process, who provides the allocated budget for each Core Service Agency and the other contracts. In addition, CDBG (Community Development Block Grant) Fund ($45,000/year allocation) is determined through NOFA (Notification of Funding Availability) process conducted by the Department of Housing and some of the Core Service Agencies have made application for these funds.
The tables below lists budget information for each major service area and their associated providers, the FY 2007-08 annual operating budget reported by each provider, the amount contracted by HSA, the number of clients served in the past fiscal year. The purpose of this table is to provide comparisons on the size and scope of each individual organization. It should be noted, however, that due to data detail questions (i.e., one CSA does not track core service budgeting separately from other services) or data gaps, several values in the tables below should be considered rough estimates only.
Source: Cores OBM Reporting (FY2007-2008); Cores On-Line Survey Responses; Human Services Contract Agreements
* Due to data detail questions (i.e., one CSA does not track core service budgeting separately from other services) or data gaps, several values in the tables above should be considered rough estimates only.
Clients gain shelter access to emergency and transitional shelter beds through the Core Service Agencies, which are strategically located throughout the county, or from St. Vincent de Paul. These agencies complete an intake process on clients, assess their needs and make referrals to the most appropriate shelter by contacting the shelter directly on the client’s behalf. Agencies may also assist the client with transportation vouchers on an as needed basis. The agencies also provide case management and provide referrals to other ancillary services as appropriate to client needs. Having multiple intake points allows homeless clients to access shelter services without having to go directly to a shelter and wait for an available bed.
The Homeless Census, a one-day count of homeless persons in the county found that on January 30, 2007, there were 2,064 homeless people. This included 1,094 homeless (unsheltered) individuals and 970 sheltered homeless people comprising 693 households. The table below shows that our current shelter capacity at any given time includes 168 emergency shelter beds and 531 transitional shelter units and beds.
Shelter Beds in San Mateo County – December 2008
EMERGENCY SHELTER |
TRANSITIONAL SHELTER | ||||||||
Provider Name |
City |
Family Units |
Family Beds |
Single Beds |
TOTAL(E) |
Family Units |
Family Beds |
Single Beds |
TOTAL (T) |
InnVision* |
Menlo Park |
6 |
24 |
38 |
62 |
6 |
24 |
26 |
50 |
Interfaith Hospitality Network |
Burlingame |
0 |
15 |
0 |
15 |
0 |
0 |
0 |
0 |
Safe Harbor Shelter |
South San Francisco |
0 |
0 |
30 |
30 |
0 |
0 |
60 |
60 |
Shelter Network – Maple Street Shelter |
Redwood City |
0 |
0 |
33 |
33 |
0 |
0 |
42 |
42 |
Shelter Network - Family Crossroads |
Daly City |
0 |
0 |
0 |
0 |
12 |
48 |
0 |
48 |
Shelter Network - Redwood Family House |
Redwood City |
0 |
0 |
0 |
0 |
9 |
36 |
0 |
36 |
Shelter Network - Haven Family House |
Menlo Park |
0 |
0 |
0 |
0 |
15 |
86 |
0 |
86 |
Shelter Network – First Step for Families |
San Mateo |
0 |
0 |
0 |
0 |
39 |
159 |
0 |
159 |
CORA |
San Mateo |
0 |
19 |
3 |
22 |
8 |
34 |
0 |
34 |
YFES - Daybreak |
Redwood City |
0 |
0 |
6 |
6 |
0 |
0 |
6 |
6 |
TOTAL BEDS |
168 |
531 | |||||||
*Serves San Mateo and Santa Clara County residents
Additional Safety Net Services
Additional safety net services funded by HSA are provided in the form of legal assistance, emergency food, and motel vouchers. The goal of the Motel Voucher Program is to prevent street homelessness for families and this program is operated through Shelter Network with referrals being made by the Core Service Agencies. An additional contract is operated by Shelter Network to provide motel vouchers for individual adults during periods of inclement weather. Another safety net provider is Second Harvest Food Bank, whose goal is to strengthen the community and develop a safety net of food services, by providing our partners with cold storage units, shelving, and other resources that allows them to serve more food to more people in their neighborhoods. Legal assistance is provided by Legal Aid, Bay Area Legal Aid, and Community Legal Services in East Palo Alto.
Provider Name |
Number Served | |
Individuals |
Families | |
HIP Housing |
880 |
421 |
Legal Aid Society |
659 |
237 |
Shelter Network - Motel Vouchers |
760 adults |
887 children |
Second Harvest Food Bank |
4,779 |
2,660 |
Bay Area Legal Aid |
142 |
-- |
Community Legal Services |
New service |
New service |
Samaritan House – Case Manager |
-- |
23 |
TOTAL |
7,220 |
4,228 |
Inventory of Services List
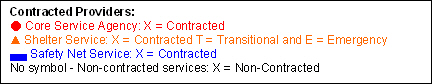
The Human Services Agency has compiled an Inventory of contracted and non-contracted safety net services that can be utilized as an over-all web of safety net services. The Inventory of Services List has been inserted below as a sample in this report and the complete Inventory of Services List can be found in the appendix on page 45 of this report. The Services included in this Inventory List are displayed to easily identify the Human Services Agency’s contracted services by, Core Service Agency, Shelter Provider and Safety Net Provider and also lists non-contracted services provided throughout San Mateo County. All services are listed alphabetically by city, and by the services each agency provides.
|
Provider Organizations Listed By City |
Prevention |
Outreach |
Supportive Services | |||||||||||||||||||||||
Mortgage Assistance |
Rental Assistance |
Rental Payment |
Utilities Assistance |
Counseling Advocacy |
Legal Assistance |
Street Outreach |
Mobile Clinic |
Law Enforcement |
Case Management |
Life Skills |
Alcohol & Drug Services |
Mental Health |
Health Care |
HIV/ AIDS |
Education |
Employment |
Child Care |
Transportation |
Hot Meals |
Showers |
Senior Centers |
Drop-In Centers |
Shelters |
Information & Referral |
Food Services | |
Daly City |
||||||||||||||||||||||||||
● Daly City Community Services Center - City of Daly City Area Served: Daly City, Colma, Broadmoor Day of Service: M - F Hours of Operation: 8:30 AM - 4:30 PM |
X |
X |
X |
X |
|
X |
X | |||||||||||||||||||
▲ Family Crossroads – Shelter Network Population: Families |
T/E |
|||||||||||||||||||||||||
Family Harvest Population: Families with Minors Day of Food Services: 4th Thurs. - Monthly
|
X | |||||||||||||||||||||||||
IV. Data Analysis and Gaps
After a thorough review of county demographics, HSA funded service providers, and inventory of services available, an analysis of data that has been collected in the past fiscal year is the basis for assessing and cross-analyzing trends shared from various sources. While certain data findings in reports are consistent, this review also found discrepancies being reported from different data sources. These areas reveal discussion points which will ultimately lead to improved data collection and reporting. The data included in this section is captured through September 2008.
This section of the report is organized by data source with analysis at the end of each set:
Food
Quarterly Contract Services Reports received from Core Service Agencies indicate that almost all residents who sought food in FY2007-08 received assistance with food (shown in the figure below), and the average of 74% of those seeking housing had their housing needs met (shown in the next figure). Furthermore, the majority of individuals and families served earn less than $25,000 per year.
![]()
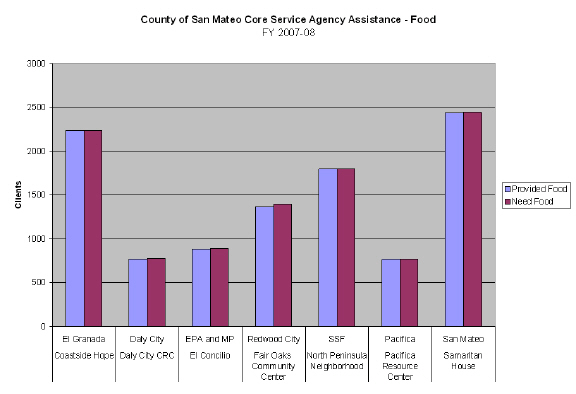
Source: Cores OBM Reporting (FY2007-2008)
Shelter
The next two tables display Core Service Agency data on the need for housing. There are inconsistencies in how each Core Service Agency defines the term “provided shelter.” It has come to our attention that some Core Service Agencies report assistance provided if a referral was made to a shelter versus others who complete this information if the client actually enters a shelter. As a result of the data analysis conducted in this report, a need has been identified to work more closely with the agencies to gain consensus on data definitions to ensure more accurate and consistent reporting in the future.
Based on the data collected to date, a summary of housing needs indicated by core clients and the outcomes associated by Core Agency is shown below:
![]()
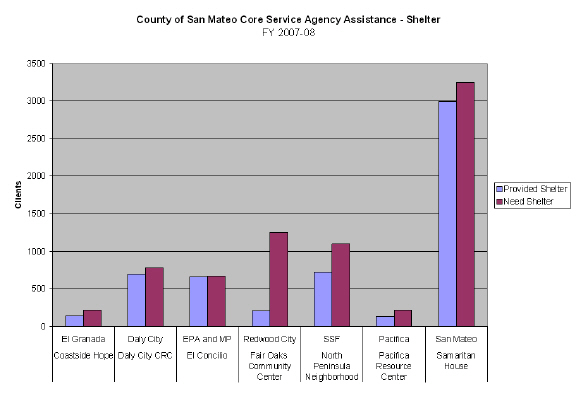
Source: Cores OBM Reporting (FY2007-2008)
A review of first quarter data from FY-2008-09 Contract Services Reports illustrates the growing need for shelter and safety net services. Both requests for housing and shelter services saw large increases in demand (highlighted in red on the table below).
Core Service Agency OBM 7/01/07 to 9/30/07 - 1st Quarter | ||||||||
|
Individuals |
Families |
Individuals Needing Food |
Individuals Assisted |
% Assisted |
Individuals Needing Shelter |
Individuals Assisted |
% Assisted |
Coastside Hope |
1,031 |
357 |
575 |
575 |
100% |
44 |
29 |
66% |
Daly City Community Services Center |
471 |
175 |
144 |
144 |
100% |
218 |
218 |
100% |
Fair Oaks Community Center |
1,759 |
715 |
715 |
695 |
97% |
327 |
46 |
14% |
North Peninsula Neighborhood Services |
1,742 |
537 |
928 |
928 |
100% |
289 |
181 |
63% |
Tides/Pacifica Resource Center |
341 |
127 |
290 |
290 |
100% |
43 |
25 |
58% |
Samaritan House |
2,053 |
745 |
860 |
860 |
100% |
1,037 |
985 |
95% |
El Concilio of San Mateo County |
1,084 |
335 |
421 |
416 |
99% |
477 |
429 |
90% |
Total |
8,481 |
2,991 |
3,933 |
3,908 |
99% |
2,435 |
1,913 |
79%* |
| ||||||||
Core Service Agency OBM 7/01/08 to 9/30/08 - 1st Quarter | ||||||||
|
Individuals |
Families |
Individuals Needing Food |
Individuals Assisted |
% Assisted |
Individuals Needing Shelter |
Individuals Assisted |
% Assisted |
Coastside Hope |
1,089 |
357 |
738 |
738 |
100% |
113 |
99 |
88% |
Daly City Community Services Center |
830 |
294 |
292 |
276 |
95% |
317 |
266 |
84% |
Fair Oaks Community Center |
2,133 |
817 |
885 |
883 |
100% |
438 |
35 |
8% |
North Peninsula Neighborhood Services |
1,976 |
609 |
1,121 |
1,117 |
100% |
334 |
290 |
87% |
Tides/Pacifica Resource Center |
501 |
187 |
304 |
304 |
100% |
233 |
226 |
97% |
Samaritan House |
2,393 |
904 |
1,182 |
1,166 |
99% |
1,285 |
1,178 |
92% |
El Concilio of San Mateo County |
1,476 |
529 |
424 |
424 |
100% |
910 |
910 |
100% |
Total |
10,398 |
3,697 |
4,946 |
4,908 |
99% |
3,630 |
3,004 |
83%* |
|
| |||||||
% Change |
+23% |
+24% |
+26% |
+26% |
+49% |
+57% |
||
Source: Cores OBM Reporting (FY2007-08, FY2008-09)
* Due to data reporting methods, the shelter assistance percentages displayed may appear elevated
The data received through the Cores Agency OBM Reporting and the recent Shelter and Safety Net survey continues to be consistent with the findings of the 2005 Safety Needs Assessment conducted by Applied Survey Research (ASR) who interviewed 140 needy San Mateo County residents. The findings from the 2005 Needs Assessment concluded the primacy of housing needs, both in terms of the number of people having housing-related needs and the lack of assistance that is available to help with these needs. The report also found that housing was second only to food in terms of the number of people expressing it as a need.
Homeless and Shelter Data
Shelter Capacity Data
The current emergency and transitional shelter capacity is not sufficient to serve the county’s homeless population. The Homeless Census, a one-day count of homeless in the county found that on January 30, 2007, there were 2,064 homeless people. This included 1,094 homeless (unsheltered) individuals and 970 sheltered homeless people comprising 693 households. The current shelter capacity at any given time, include 168 emergency shelter beds and 531 transitional shelter units and beds.
General Trends of Shelter Services Usage
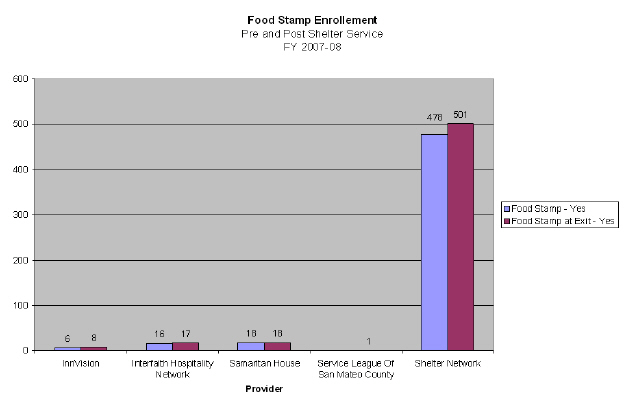
Data reported from the HMIS reflects information entered into the system by the providers. Current data show that the majority of clients are not receiving cash benefits either at entry or exit of programs. Whether this is poor data entry, length of stay at shelters is insufficient time for benefits to be processed and reported, or ineffective use of program service is unclear at this time. This is an issue which requires follow up at the HMIS meetings.
While the HMIS data are reflective of the numbers below, the Center on Homelessness staff recommends submitting the numbers compiled in the 2007 Homeless Census and Survey Report as the most comprehensive data collected in the homeless population.
Data Highlights
One Day Census Results
Veteran Status
Twenty-seven percent of the survey respondents reported having served in the US Armed Forces. This is fairly consistent with national data. Estimate of the number of homeless people who are veterans range from 19% up to 40%.
Disability
The survey data demonstrated that a large majority of homeless people in San Mateo County are disabled. Of those surveyed, 72% reported having at least one disability. Many clients reported having multiple disabilities:
• 28% of those interviewed reported having no disabilities
• 26% had one disability
• 20% had two disabilities
• 26% had three or more disabilities
The types of disabilities reported included mental illness, substance abuse, chronic health conditions, physical and developmental disabilities:
• 57% reported having depression
• 35% reported having a mental illness
• 35% reported having a physical disability
• 33% reported drug abuse
• 31% reported alcohol abuse
• 39% reported either drug abuse or alcohol abuse or both
• 28% reported chronic health problems
• 26% reported post traumatic stress disorder
• 12% reported developmental disability
• 2% reported HIV/AIDS
(Respondents were asked to report all applicable disabilities, so the totals do not add up to 100 %.)
National data suggests that those homeless people who have co-occurring mental health and/or substance abuse and/or chronic health conditions typically face the most challenges in securing and maintaining housing, tend to be frequent users of costly emergency services and are very likely to have improved outcomes when supportive housing is secured. The survey found that:
• 13% of those surveyed had co-occurring mental illness and substance abuse
• 7% had co-occurring mental illness, substance abuse and chronic health conditions
In spite of the large numbers of homeless people with disabilities and without employment, a significant percentage reported having no support from government benefit programs (e.g. food stamps, SSI, etc.:
• 36% receive no government benefits
• 30% receive food stamps
• 20% receive General Assistance
• 20% receive Medi-Cal/ Medicare
• 13% receive SSI (Supplemental Security Income) or SSDI
• 10% receive veterans benefits
• 7% receive CalWORKs
Service Need and Usage
The survey data documented that use of available social services among homeless people was relatively high, with only 4% reporting that no services were used at all. However, the data suggests that there were significant gaps in the service system – many homeless people are not utilizing several of the services available to them:
• While 80% of homeless people surveyed were unemployed, only 12% of those interviewed reported using job training services.
• Of those who reported having a mental illness, only 54% reported receiving mental health services.
• Of those who reported having a substance abuse problem, only 64% indicated that they were receiving substance abuse counseling.
• About 27% of those surveyed were veterans, however only 10% reported receiving veteran’s benefits. This is consistent with national data that indicates that while anywhere from 20% to 40% of homeless people are veterans; many of them do not receive any veteran’s benefits.
HMIS Data Analysis:
• Shelter Network Provided: 70% of services
• Veterans 360 of 3836 (9.4%)
• Disabled 359 of 3836 (9.4%)
• Food Stamps 578 of 3836 (15.1%)
• GA 55 of 3836 (1.4%)
• CalWORKs 291 of 3836 (7.6%)
Of the 2,835 homeless clients recorded in the HMIS for FY 07-08 who entered and exited programs in the system, 949 or 33.47% exited to permanent housing.
Homeless Management Information Systems Data
Data collected in the Homeless Management Information System (HMIS) captures approximately 90% of shelters countywide and provides a range of demographic, service, and outcome statistics. When a client arrives at a shelter for service, a Program Entry form is administered. This same process is also performed when an individual client leaves the shelter.
Highlights of HMIS Data Analysis:
Client Profile:
An examination of demographic data within HMIS reveals a “composite” client profile for shelter services during FY 2007-08. The table below illustrates this along with the percent occurrence of the characteristic.
County-wide Shelter Program - HMIS Client Profile | ||
| ||
Total Clients |
3836 |
100% |
Race |
White |
46.6% |
Ethnicity |
Non-Hispanic Latino |
71.5% |
Age |
41-64 |
33.9% |
Gender |
Male |
52.6% |
Last Known Address |
Redwood City, CA |
15.4% |
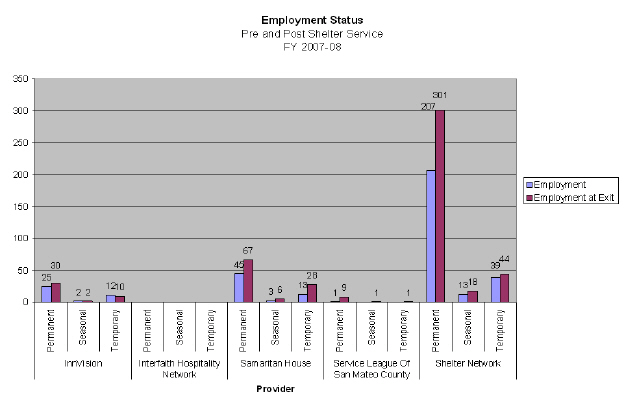
Employment |
Not Employed |
54.2% |
Disability |
Not Disabled |
87.1% |
General Assistance |
Not Enrolled |
98.6% |
Food Stamp |
Not Enrolled |
80.1% |
CalWORKs |
Not Enrolled |
92.4% |
Veteran Status |
Non-Veteran |
77.3% |
Services Rendered:
A review of shelter data found that 3,836 residents received shelter services from eight providers consisting of thirty-four programs across the County of San Mateo, as illustrated below:
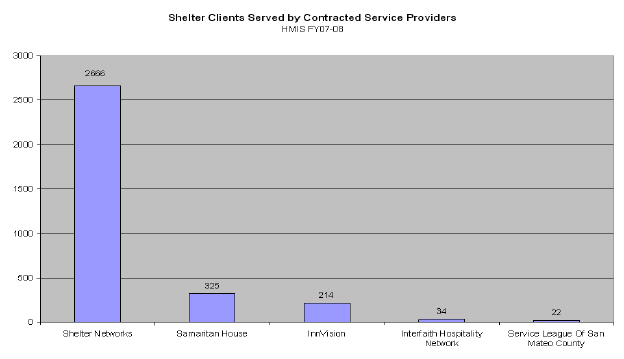
Source: FY 2007-08 HMIS report
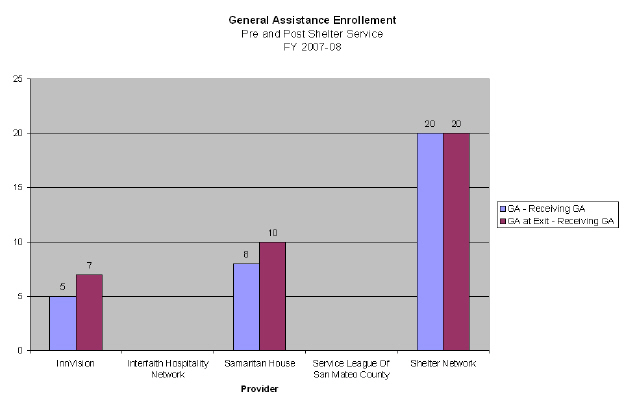
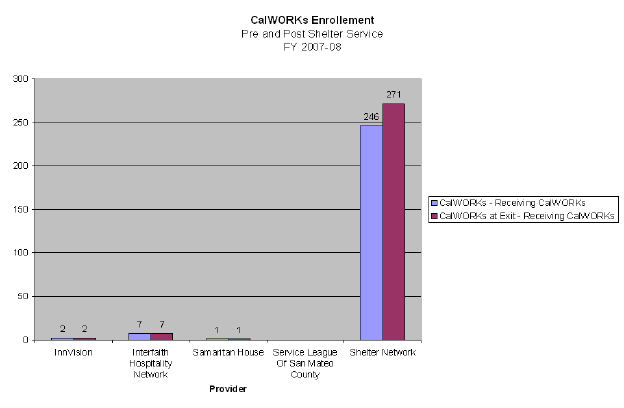
However, examination of HMIS information collected prior to shelter entry and compared to exit data (see charts below) indicates a consistent underutilization of state and federal programs offered to assist low income and homeless individuals. Very little improvement is found afterwards, despite having stayed at a facility where these services can be initiated.
Number of Clients Receiving State and Federal Services | ||
|
Number Receiving Services |
Percent of Shelter Clients |
Disability |
359 |
9.4% |
General Assistance |
55 |
1.4% |
Food Stamps |
578 |
15.1% |
CalWORKs |
291 |
7.6% |
Veteran |
360 |
9.4% |
While data show a low number of clients linked to services while in-shelter, the number of eligible clients is unknown. There is no data on how many clients may have applied for benefits but left the shelter before their eligibility was determined.
Source: FY 2007-08 HMIS report
Source: FY 2007-08 HMIS report
Source: FY 2007-08 HMIS report
Source: FY 2007-08 HMIS report
Safety Net and Shelter Client Profiles
Homeless individuals do not always seek the assistance of emergency homeless shelters. There still remains a social stigma regarding the use of shelters, and some individuals and families in need may prefer not to be housed, but want to know resources to get their needs met.
A review of Core provider contract services reporting data reveals a profile of residents served by the Cores and of residents that received services at the shelter locations is shown in the figure below:
 Source: Cores OBM Reporting (FY2007-2008)
V. Conclusion and Key Highlights
This report recognizes that there are multiple service gaps that need immediate attention particularly in areas regarding service availability limitations, special populations, funding and geographical disproportionality.
Limitations in Service Availability
Based upon recent research conducted to update the inventory of services (Appendix A), there are a wide variety of services that are available as part of the county’s social safety net. However, in some instances, availability is limited to specific populations, locations, days of the week, and time periods.
• Seven Core Service Agencies serve as access points throughout the county, but there are some communities of need who do not have a Core Service Agency within their immediate vicinity, e.g. Pescadero area.
• Although there are multiple points of entry for services, many may not provide appropriate services to every individual and family in need.
• There is a shortage of services offered during the day for homeless individuals and families. While some shelters offer day services, either on-site or at a nearby affiliated location, some do not always address the multiple needs of the clients.
• There are few services that are available seven days a week, twenty four hours a day. Without after hours or weekend service ability, the existing network is limited to those who can or need services on weekdays.
• There are limitations in access to services due to transportation barriers. Although public transportation is available throughout the county, the frequency or location of stops may not be adequate for clients who rely on public transportation.
• The decline in the economy creates a dynamic situation, resulting in potential loss of services provided by community organizations, such as the proposed closure/re-location of Clara-Mateo Shelter due to budget shortfalls.
Special Populations
The Core Service Agencies serve as the traditional safety net for the county. There are also many organizations, not funded by HSA, who provide services to special populations.
• Immigration Status: The County of San Mateo has made a commitment to serve all county residents, regardless of immigration status. While there are public assistance programs available for individuals and families who quality for benefits or health insurance, there are many who don’t qualify or are ineligible for services. The Core Service Agencies serve as the primary safety net for individuals who do not quality for public social services due to immigration status.
• Who the Core Agencies are Serving: Data received from the Core Service Agencies reveal that in every area but Pacifica, there is a higher proportion of Hispanics seeking housing services. A large percentage of individuals who seek housing on the coast report having been homeless for over one year, and those who seek housing from Fair Oaks Community Center (Redwood City) and Samaritan House (San Mateo) report having had more than one episode of homelessness. Those seeking services from the Core Service Agencies are more likely families, female, between the ages of 18-54. Those entering emergency and transitional shelters throughout the county are more likely a White male, between the ages of 41-64, with a last known address of Redwood City.
• Individuals with Physical, Mental Health, or Substance Abuse Challenges: Many individuals who seek services also report having physical disabilities, mental health or substance abuse issues. Two Core Service Agencies are seeing a higher percentage of these individuals, which present additional challenges in service provision due to their complex treatment needs. Pacifica Resource Center reports that15.1%, and Fair Oaks Community Center reports 9.3% of clients self-identified having physical, mental health, or substance abuse issues. Data from the Homeless Management Information System shows that clients in shelters may not be accessing public benefits for which they may be eligible, with the respective enrollment rates: General Assistance (9.4%), Food Stamp (15.1%), and CalWORKs (7.6%). Of the 3,836 clients served in shelters in FY 07-08, 9.4% reported having a disability and 9.4% reported having veteran status.
• Faith-based Providers and Congregations: There is acknowledgement that HSA needs to improve partnerships with other agencies, such as faith-based organizations (St. Vincent de Paul, Salvation Army), congregations, and other such organizations who provide specific, and appropriate care to those not served by the Core Agencies. There is an existing and much needed role of faith-based community supporting special needs populations, however HSA has limited visibility into faith-based support activities.
Current Funding Situation
The concept of a service coordination model delivered through seven Core Service Agencies in San Mateo County is unique and innovative within the state. This model has existed since 1976, and there are only a handful of counties that fund these services, which are an essential component in our county’s social safety net system. The Core Service Agencies model assures that individuals and families receive integrated care across a range of services. There is also recognition of the importance of accessible points of entry to link clients to community support and social services within each community. With this concept being over 30 years old, a review of its efficacy is warranted to ensure future compliance with emerging best practices.
Our efforts in San Mateo have shown preliminary success; data obtained from the Core Service Agencies data were consistent with the online survey that showed the Core Agencies were able to meet 100% of the food needs and 74% of the housing of individuals and families who seek services. This data is reported to the County Manager’s Office as a performance measure semi-annually, however, caution should be exercised in its interpretation. There is no consistent definition among how the Core Service Agencies define meeting needs, and staff from the Center on Homeless will develop an improvement plan to clarify definitions and terms in order to ensure consistency in data reporting.
In San Mateo County, Core Service Agencies, shelters, and safety net services are funded mostly by County General Fund. A small portion of funding to the providers comes from other government funding and sources, from sources such as CalWORKs and Community Development Block Grant from the County Department of Housing. Two of the Core Service Agencies (Daly City and Redwood City) are operated by their respective cities and thus receive funding from their cities.
The Human Services Agency develops annual contracts with several community based agencies, but the funding amount is not sufficient to sustain an entire agency’s operational budget. Many organizations conduct individual fund development by applying for competitive grants, coordinating fundraising events, and corporate sponsorships. In tough times, and especially in our current recession, discretionary funding is more difficult to obtain. Due to budgetary constraints faced by governmental agencies, it remains a challenge to balance the availability of funds with keeping up with increases in the cost of doing business. Community foundations are also faced with the difficult decision to prioritize funding to specific populations or services in their area.
Disproportionality in Geographical Areas
San Mateo County is a geographically dispersed county, with some cities and neighborhoods having greater needs or barriers and limited access to community resources. While there remains the need for core services throughout the county, findings from this report reveal three communities in the county that are faced with more challenges to obtaining safety net services, the South Coast area, North Fair Oaks in Redwood City, and East Palo Alto. This is based on a variety of indicators, including unemployment rate, availability of services, and data obtained from clients currently being served at homeless shelters and Core Service Agencies.
• The Inventory of Services in Appendix A and county maps of HSA contracted and non-HSA contracted services clearly show that service gaps exist in the coast. The visual depiction shows that there are only a few community organizations that serve the broad central and south coast region.
• The 2007 homeless census and survey data identified three communities that had a percentage of the unsheltered homeless population higher than their share of the general population: East Palo Alto, Redwood City and Half Moon Bay.
South Coast
The South Coast of San Mateo County includes the rural cities of Pescadero, La Honda, San Gregorio and Loma Mar. Coastside Hope, the Core Service Agency located in El Granada, is contracted to serve the cities of Montara, Moss Beach, El Granada, Half Moon Bay, La Honda and Pescadero. However, due to limited transportation routes and the physical location of the Core Service Agency being in El Granada, many county residents who live further away on the south coast are not served. There are additional community organizations in El Granada, Half Moon Bay and Pescadero, however these groups are also limited in the scope of services provided, which include the range of education, health, transportation, meals on specific days and hours to certain populations, and services to seniors.
Puente de la Costa Sur, a community agency in Pescadero that is not funded by HSA as a Core Service Agency, provides critical services to an area of the South Coast which is not served by Coastside Hope and functions like a Core Service Agency. Puente de la Costa Sur (Puente Resource Center) is the only provider of safety net services in a 160-square mile area, providing vital services for men, women, children, and families living in the South Coast communities of Pescadero, La Honda, Loma Mar and San Gregorio. Staff from HSA is located on-site, and services provided are funded by other grants, some from other programs of HSA. Puente provides food, clothing, rental and utility assistance; literacy programs for English and Spanish learners; enrollment in health insurance programs; educational health outreach, screening, and immunizations; parenting education and support programs and counseling and peer support for adults and children. Approximately 5,000 people live in the Pescadero region, according to the 2000 Census and there were 1,114 households in the area. Puente’s food program serves 14.9% of households in the region. Nearly 40% of the South Coast’s 5,000 residents earn less than $15,000 annually. Clearly, this is a community in need and could benefit from Puente being identified as a Core Service Agency.
North Fair Oaks, Redwood City
The North Fair Oaks community of Redwood City faces its own economic challenges, with a current unemployment rate in the North Fair Oaks area of 10.9%. Fair Oaks Community Center is the Core Service Agency located and serving Redwood City. Core service reports made available quarterly to HSA shows that a lower percentage of individuals and families who seek services are able to have their needs met. It should be noted that this center serves a high percentage of clients who report having a disability and in data from the HMIS system shows that the highest proportion of homeless clients (15.4%) reported Redwood City as their last known address. The current unemployment rate in the North Fair Oaks area is 10.9%.
East Palo Alto and Menlo Park
East Palo Alto is one of the county’s most diverse communities, with approximately one quarter of the county’s African American, Native Hawaiian and Pacific Islander populations. East Palo Also has the highest city unemployment rate in the county at 13.1%. There is currently no homeless shelter located in the city and residents of East Palo Alto have experienced barriers to accessing the shelter beds in the existing shelters. A Community Input Meeting was held in August 2008 to address the issue of East Palo Alto’s Homeless/Unhoused Population. Human Services Agency is currently exploring means to support an East Palo Alto community congregation in providing beds to homeless individuals during the winter months.
Conclusion
Based on the key findings listed above, this report has concluded the following:
• The need for shelter and safety net services has rapidly risen as the economic downturn continues.
• Challenges remain in access to services:
o The general public continues to experience confusion regarding how to access shelter and safety net services.
o South Coast area residents, due to proximity, are unable to access the existing Core Service Agency in El Granada. Residents are currently supported by a small community-based organization (Puente de la Costa Sur) with minimal funding from HSA.
o There is a need to link homeless individuals to services during the day.
o Few county-funded services are available seven days a week
o Services may not be accessible to clients who most need them due to transportation barriers
• Collaboration and Coordination must continue:
o There is a need to collaborate with faith-based providers to increase service accessibility, particularly to clients who are not served by the Core Service Agencies
o There is a need to more closely collaborate across county departments around the coordinated delivery of shelter and safety net services.
• Funding remains a challenge at federal, state, and county levels as a result of the recent economic downturn.
• Service providers are impacted due to budgetary constraints faced by government agencies and grant providers
• There is increased risk due to the potential loss of emergency shelter beds due to the loss of lease at the Menlo Park VA campus (112 shelter beds)
VI. Recommendations
Recommendations have been developed for discussion based on the data reviewed and analyzed in this report. It is recommended that any further action include a clear, goal-oriented action plan with a clear outline of responsibility. A continuous quality improvement plan should also be developed and implemented in order to monitor progress and ensure a system for reporting out on a quarterly basis. It is also recognized that any final recommendations and actions will require a close partnership with other partners to ensure sustainable solutions are embraced.
Based on the conclusions set forth in this report, the recommendations are as follows:
A. Increase Access to Services
• Fund the placement of homeless benefits liaisons at homeless shelters to increase enrollment of eligible individuals in public assistance programs.
• Expand HOT teams to additional areas within the county.
• Conduct an additional homeless veteran stand-down event to connect them with veterans and homeless services – Fall 2009.
B. Increase/Sustain Capacity of Shelter and Safety Net Services:
• Fund Puente de la Costa Sur as a Core Service Agency serving South Coast residents.
• Fund a seasonal warming shelter in East Palo Alto.
• Support HOPE/IAC report recommendations to sustain shelter beds at current capacity by identifying an alternate, in-county shelter location that replaces Clara-Mateo.
• Residents that currently occupy daytime shelter services should be served by an existing community based service.
C. Facilitate Collaboration:
• Convene a homeless summit in the spring 2009 to specifically address the results of the one-day homeless census.
• Convene quarterly meetings with faith-based, CBOs, foundations, and volunteer organizations to strengthen community partnerships.
D. Monitor Performance Outcomes:
• Develop a continuous quality improvement plan and a system for reporting out on a quarterly basis.
• Publish a Bi-Annual Safety Net Report Card.
Appendix A: Inventory of Safety Net Services in San Mateo County
The Human Services Agency has collected up-to-date information on both contracted and non-contracted services that can be utilized as a web of services that supports our current contracted network of services. This inventory list has been arranged by city and type of service provided.
|
Provider Organizations Listed By City |
Prevention |
Outreach |
Supportive Services | ||||||||||||||||||||||||
Mortgage Assistance |
Rental Assistance |
Rental Payment |
Utilities Assistance |
Counseling Advocacy |
Legal Assistance |
Street Outreach |
Mobile Clinic |
Law Enforcement |
Case Management |
Life Skills |
Alcohol & Drug Services |
Mental Health |
Health Care |
HIV/ AIDS |
Education |
Employment |
Child Care |
Transportation |
Hot Meals |
Showers |
Senior Centers |
Drop-In Centers |
Shelters |
Information & Referral |
Food Services |
Clothing | |
Belmont |
|||||||||||||||||||||||||||
Twin Pines Senior and Community Center Population: Seniors |
X |
X |
X |
||||||||||||||||||||||||
▲ Interfaith Hospitality Network – Congregational Church of Belmont – UCC Population: Families Rotating service - Not always available |
X |
X |
X |
E |
X |
||||||||||||||||||||||
Burlingame |
|||||||||||||||||||||||||||
CALL – Primrose Center Service Area: Between San Bruno and San Carlos Days of Service: M-F Hours: 9:00 am - 3:00pm |
X |
||||||||||||||||||||||||||
New Horizons Population: Adults |
X |
X |
X |
||||||||||||||||||||||||
Contracted Providers: ● Core Service Agency: X = Contracted ▲ Shelter Service: X = Contracted T = Transitional and E = Emergency ▄▄ Safety Net Service: X = Contracted No symbol - Non-contracted services: X = Non-Contracted |
|||||||||||||||||||||||||||
Burlingame |
|||||||||||||||||||||||||||
Burlingame Nutrition Program Population: Seniors |
X |
X |
|||||||||||||||||||||||||
▲ Interfaith Hospitality Network – First Presbyterian Church of Burlingame Population: Families Rotating service - Not always available |
X |
X |
X |
E |
X |
||||||||||||||||||||||
▲ Interfaith Hospitality Network – St. Paul’s Episcopal Church Population: Families Rotating service - Not always available |
X |
X |
X |
E |
X |
||||||||||||||||||||||
▲ Interfaith Hospitality Network – Burlingame United Methodist Church Population: Families Rotating service - Not always available |
X |
X |
X |
E |
X |
||||||||||||||||||||||
▲ Interfaith Hospitality Network – Good Shepard Lutheran Church Population: Families Rotating service - Not always available |
X |
X |
X |
E |
X |
||||||||||||||||||||||
Burlingame |
|||||||||||||||||||||||||||
FISH (Friends in Service to Humanity) Population: Seniors |
X |
X |
X |
X |
|||||||||||||||||||||||
▲ Interfaith Hospitality Network – St. Catherine of Siena Catholic Church Population: Families Rotating service - Not always available |
X |
X |
X |
E |
X |
||||||||||||||||||||||
Shelter Network – Case Manager |
X |
||||||||||||||||||||||||||
Women’s Recovery Association Population: Women |
X |
||||||||||||||||||||||||||
Colma |
|||||||||||||||||||||||||||
Family Harvest Population: Families with Minors Days of Food Service: 4th Tuesday (Monthly) Hours: 2:30 - 4:00 pm |
X |
||||||||||||||||||||||||||
Daly City |
|||||||||||||||||||||||||||
Lincoln Park Community Center Population: Seniors Days of Service: M-F |
X |
X |
X |
||||||||||||||||||||||||
North Peninsula Food Pantry and Dining Center Days of Services: T/Th |
X |
X |
|||||||||||||||||||||||||
Daly City |
|||||||||||||||||||||||||||
● Daly City Community Services Center – City of Daly City Service Area: Daly City, Colma, Broadmoor Days of Service: MTWF Hours: 8:30 am - 4:30 pm & Thursday 1 - 4:30 pm |
X |
X |
X |
X |
X |
X |
X | ||||||||||||||||||||
▲ Family Crossroads – Shelter Network Population: Families |
T/E |
||||||||||||||||||||||||||
Family Harvest Population: Families with Minors Day of Food Services: 4th Thursday (Monthly) Hours: 4:00 - 6:00 pm |
X |
||||||||||||||||||||||||||
Family Harvest – Teglia Community Center Population: Families with Minors Day of Food Services: 3rd Monday (Monthly) |
X |
||||||||||||||||||||||||||
Doelger Senior Center Population: Seniors |
X |
X |
X |
||||||||||||||||||||||||
Self-Help for the Elderly (Daly City Center) Population: Homebound Seniors age 60+ Days of Service: M-F |
X |
X |
X |
X |
X |
||||||||||||||||||||||
Daly City |
|||||||||||||||||||||||||||
Daly City Clinic (San Mateo Medical) |
X |
X |
X |
||||||||||||||||||||||||
Asian American Recovery Services Population: Men and Women |
X |
||||||||||||||||||||||||||
East Palo Alto |
|||||||||||||||||||||||||||
East Palo Alto Senior Center Population: Seniors |
X |
X |
X |
X |
X |
X |
|||||||||||||||||||||
● El Concilio Emergency Services Partnership Service Area: East Palo Alto and Menlo Park Days of Service: MWF Hours: 9:00 am - 5:00 pm |
X |
X |
X |
X |
X |
X |
X | ||||||||||||||||||||
Community Legal Services |
X |
||||||||||||||||||||||||||
St. Francis of Assissi Church Days of Service: M Hours: 5:30 - 6:15 pm |
X |
||||||||||||||||||||||||||
Bread of Life Evangelistic Outreach |
X |
E |
X |
X |
|||||||||||||||||||||||
Ecumenical Hunger Program Population: All Days of Service: M-F Hours: 9:00 am - 5:00 pm |
X |
X |
X |
||||||||||||||||||||||||
East Palo Alto |
|||||||||||||||||||||||||||
Free at Last Population: All |
X |
X |
X |
X |
X |
||||||||||||||||||||||
Ravenswood Family Health Center |
X |
X |
|||||||||||||||||||||||||
El Granada |
|||||||||||||||||||||||||||
● Coastside Hope Service Area; Montara, Moss Beach, El Granada, Half Moon Bay, La Honda and Pescadero Days of Service: M, T, TH, F Hours: 9:00 am - 5:00 pm and Wed. 1:00 - 5:00 pm |
X |
X |
X |
X |
X |
X |
X |
X | |||||||||||||||||||
Family Harvest Population: Families with Minors Days of Service: 3rd Thu Hours: 3:00 - 5:30 pm |
X |
||||||||||||||||||||||||||
Foster City |
|||||||||||||||||||||||||||
▲ Interfaith Hospitality Network – St. Ambrose Episcopal Church Population: Families Rotating service - Not always available |
X |
X |
X |
E |
X |
||||||||||||||||||||||
Peninsula Jewish Community Center Population: Seniors |
X |
X |
X |
X |
X |
||||||||||||||||||||||
Foster City |
|||||||||||||||||||||||||||
Foster City Parks and Recreation Department/ Senior Wing Population: Seniors |
X |
X |
X |
||||||||||||||||||||||||
Half Moon Bay |
|||||||||||||||||||||||||||
Senior Coastsiders Population: Seniors/ Adults with Disabilities |
X |
X |
X |
X |
X |
X |
|||||||||||||||||||||
Coastside Catholic Worker House Population: All |
X |
T/E |
X |
||||||||||||||||||||||||
Coastside Breakfast Population: All Days of Service: Saturday Hours: 9:00 - 10:00 am |
X |
||||||||||||||||||||||||||
El Centro de Libertad Population: Youth aged 12-17 and adult men and women Days of Service: M-F Hours: M/Th (12 - 8 pm) T (3-8 pm) W (9-8 pm) Th (12-8 pm) F (8-4 pm) |
X |
||||||||||||||||||||||||||
Menlo Park |
|||||||||||||||||||||||||||
St. Anthony’s Padua Dining Room Population: All Days of Service: M-Sat Hours: 11:00 - 1:00 pm |
X |
||||||||||||||||||||||||||
Menlo Park |
|||||||||||||||||||||||||||
Menlo Park Parks and Community Services Department/ Menlo Park Senior Center |
X |
X |
X |
X |
|||||||||||||||||||||||
▲ Interfaith Hospitality Network – St. Bede’s Episcopal Church Population: Families Rotating service - Not always available |
X |
X |
X |
E |
X |
||||||||||||||||||||||
▲ Interfaith Hospitality Network – Trinity Parish Episcopal Church Population: Families Rotating service - Not always available |
X |
X |
X |
E |
X |
||||||||||||||||||||||
▲ Interfaith Hospitality Network Population: Families Rotating service - Not always available |
X |
X |
X |
E |
X |
||||||||||||||||||||||
Homeless Veterans Rehabilitation Program Population: Homeless Veterans |
T/E |
||||||||||||||||||||||||||
InnVision/ Clara-Mateo Alliance |
X |
X |
X |
X |
T/E |
||||||||||||||||||||||
Peninsula Volunteers/ Little House |
X |
X |
X |
X |
X |
||||||||||||||||||||||
Menlo Park |
|||||||||||||||||||||||||||
▲ Haven Family House – Shelter Network Population: Families |
T/E |
||||||||||||||||||||||||||
Millbrae |
|||||||||||||||||||||||||||
▲ Interfaith Hospitality Network – St. Dunstan Catholic Church Population: Families Rotating service - Not always available |
X |
X |
X |
X |
E |
X |
|||||||||||||||||||||
Chardbourne Adult Activity Center Population: Seniors |
X |
X |
X |
X |
|||||||||||||||||||||||
Millbrae Senior Center Population: Seniors |
X |
X |
X |
||||||||||||||||||||||||
Pacifica |
|||||||||||||||||||||||||||
● Tides Pacifica Resource Center Service Area: Pacifica Days of Service: M-F Hours: 8:30 am - 5:30 pm |
X |
X |
X |
X |
X |
X |
X |
X |
X |
X |
X | ||||||||||||||||
Meals on Wheels Population: Frail/ Home restricted Days of Service: M-F |
X |
||||||||||||||||||||||||||
Pacifica Senior Services Population: Seniors 60+ Food Service Days and Hours: 12:00 noon M-F |
X |
X |
X |
X |
X |
||||||||||||||||||||||
Pacifica |
|||||||||||||||||||||||||||
Family Harvest Population: Families with Minors Days of Service: 3rd Wednesday (Monthly) Hours: 4:00 - 6:00 pm |
X |
||||||||||||||||||||||||||
Pescadero |
|||||||||||||||||||||||||||
Puente de La Costa Sur Areas Served: Pescadero, Loma Mar, La Honda, San Gregorio Population: All Days of Service: M-F Hours: 9:00 am - 5:00 pm |
X |
X |
X |
X |
X |
X |
X |
X |
|||||||||||||||||||
Family Harvest Population: Families with Minors Days of Service: 2nd Thursday Hours 3:00 - 6:00 pm |
X |
||||||||||||||||||||||||||
South Coast Collaborative Population: All |
X |
||||||||||||||||||||||||||
Portola Valley |
|||||||||||||||||||||||||||
▲ Interfaith Hospitality Network – Christ Church, Portola Valley Population: Families Rotating service - Not always available |
X |
X |
E |
X |
|||||||||||||||||||||||
Redwood City |
|||||||||||||||||||||||||||
● Fair Oaks Community Center – City of Redwood City Service Area: Redwood City, Woodside, Atherton and Portola Valley Days of Service: M-F Hours: 8:00 am-4:00 pm |
X |
X |
X |
X |
X |
X |
X |
X |
X |
X |
X | ||||||||||||||||
▲ Interfaith Hospitality Network – Redeemer Lutheran Church Population: Families Rotating service - Not always available |
X |
X |
X |
E |
X |
||||||||||||||||||||||
▲ Interfaith Hospitality Network – St. Peter’s Episcopal Church Population: Families Rotating service - Not always available |
X |
X |
X |
E |
X |
||||||||||||||||||||||
▲ Maple Street Shelter – Shelter Network Population: Single Adults |
T/E |
||||||||||||||||||||||||||
Catholic Worker House Population: Youth |
T/E |
||||||||||||||||||||||||||
Your House South - YFES Population: Youth Days of Service: Daily Hours: 24 hour services |
T/E |
||||||||||||||||||||||||||
Redwood City |
|||||||||||||||||||||||||||
▲ Daybreak – YFES Population: Youth Days of Service: Daily |
X |
X |
X |
X |
X |
X |
T |
||||||||||||||||||||
▲ Redwood Family House – Shelter Network Population: Families |
T/E |
||||||||||||||||||||||||||
El Centro de Libertad Population: Youth aged 12-17 and adults |
T/E |
||||||||||||||||||||||||||
Spring Street Shelter Population: Mentally disabled adults |
T/E |
||||||||||||||||||||||||||
Redwood City Parks, Recreation and Community Services Department Population: Seniors |
X |
X |
|||||||||||||||||||||||||
Redwood City Veterans Memorial Senior Center Population: Seniors |
X |
X |
X |
X |
X |
||||||||||||||||||||||
Mental Health Assoc. of San Mateo County |
X |
X |
X |
||||||||||||||||||||||||
St. Vincent de Paul Drop-in Assistance Days of Service: M-F Hours: 10 am - 12 noon Population: All |
X |
X |
X |
X |
X | ||||||||||||||||||||||
St. Francis Center Population: Families |
X |
X |
X |
X |
|||||||||||||||||||||||
Redwood City |
|||||||||||||||||||||||||||
Salvation Army Population: All Hours and Days of Service: 9:00 - 4:00 pm M-Th; 9:00 - 3:00 pm F |
X |
X |
X |
||||||||||||||||||||||||
Service League of San Mateo Population: Adults |
X |
T/E |
|||||||||||||||||||||||||
San Bruno |
|||||||||||||||||||||||||||
San Bruno Senior Center Population: Seniors |
X |
X |
X |
X |
|||||||||||||||||||||||
San Bruno House Population: Single Adults |
T/E |
||||||||||||||||||||||||||
Catholic Worker Hospitality House Population: All Days of Service: Tues-F Hours: 7:00 - 9:00 am |
X |
X |
X |
||||||||||||||||||||||||
San Carlos |
|||||||||||||||||||||||||||
▲ Interfaith Hospitality Network – Community Church of Christ Population: Families Rotating service - Not always available |
X |
X |
X |
E |
X |
||||||||||||||||||||||
San Mateo County Transit District (SamTrans) Redi-Wheels and Redi-Coast |
X |
||||||||||||||||||||||||||
San Carlos |
|||||||||||||||||||||||||||
FISH (Friends in Service to Humanity) Trinity Presbyterian Church |
X |
||||||||||||||||||||||||||
▲ Interfaith Hospitality Network – Trinity Presbyterian Church Population: Families Rotating service – Not always available |
X |
X |
X |
E |
X |
||||||||||||||||||||||
▲ Interfaith Hospitality Network – St. Charles Catholic Church Population: Families Rotating service – Not always available |
X |
X |
X |
E |
X |
||||||||||||||||||||||
▲ Interfaith Hospitality Network – St. Andrews Lutheran Church Population: Families Rotating service – Not always available |
X |
X |
X |
E |
X |
||||||||||||||||||||||
▲ Interfaith Hospitality Network – Peninsula Metropolitan Community Church Population: Families Rotating service – Not always available |
X |
X |
X |
E |
X |
||||||||||||||||||||||
San Carlos |
|||||||||||||||||||||||||||
▲ Interfaith Hospitality Network – College Heights Population: Families Rotating service – Not always available |
X |
X |
X |
E |
X |
||||||||||||||||||||||
▲ Interfaith Hospitality Network – Chalice Christian Church Population: Families Rotating service - Not always available |
X |
X |
X |
E |
X |
||||||||||||||||||||||
▲ Interfaith Hospitality Network – Episcopal Church of the Epiphany Population: Families Rotating service - Not always available |
X |
X |
X |
E |
X |
||||||||||||||||||||||
San Carlos Adult Community Center Population: Seniors |
X |
X |
X |
||||||||||||||||||||||||
San Mateo |
|||||||||||||||||||||||||||
Martin Luther King Center/ San Mateo Parks and Recreation Dept. Population: Seniors |
X |
||||||||||||||||||||||||||
Palm Avenue Detox Center Population: Men/ women |
X |
||||||||||||||||||||||||||
San Mateo |
|||||||||||||||||||||||||||
● Samaritan House Service Area: Millbrae, Burlingame, San Mateo Hillsborough, Foster City, Belmont and San Carlos Days of Service: M,W,F Hours: 9:00 - 5:00 pm & T, TH 10:00 – 5:00 pm |
X |
X |
X |
X |
X |
X |
X |
X |
X |
X | |||||||||||||||||
Samaritan House Case Manager Services Service Area: Central county, Pacifica and Coastside Population: At risk of homelessness |
X |
||||||||||||||||||||||||||
Project 90 – Intermission House Population: Youth aged 14-17 |
X |
||||||||||||||||||||||||||
Project 90 Population: Men |
X |
||||||||||||||||||||||||||
First Step for Families – Shelter Network Population: Families |
T/E |
||||||||||||||||||||||||||
▲ Interfaith Hospitality Network – Peninsula Temple Beth El Population: Families Rotating service - Not always available |
X |
X |
X |
E |
X |
||||||||||||||||||||||
San Mateo |
|||||||||||||||||||||||||||
▲ Interfaith Hospitality Network – Congregational Church of San Mateo, UCC Population: Families Rotating service- Not always available |
X |
X |
X |
E |
X |
||||||||||||||||||||||
▲ Interfaith Hospitality Network – Transfiguration Episcopal Church Population: Families Rotating service - Not always available |
X |
X |
X |
E |
X |
||||||||||||||||||||||
▲ Interfaith Hospitality Network – Unitarian Universalists of San Mateo Population: Families Rotating service - Not always available |
X |
X |
X |
E |
X |
||||||||||||||||||||||
▲ Interfaith Hospitality Network – Hillside United Methodist Church Population: Families Rotating service - Not always available |
X |
X |
X |
E |
X |
||||||||||||||||||||||
Legal AID Society of San Mateo County |
X |
||||||||||||||||||||||||||
San Mateo |
|||||||||||||||||||||||||||
▲ Interfaith Hospitality Network – First Presbyterian Church of San Mateo Population: Families Rotating service - Not always available |
X |
X |
X |
E |
X |
||||||||||||||||||||||
▲ Interfaith Hospitality Network – Hope Evangelical Lutheran Church Population: Families Rotating service - Not always available |
X |
X |
X |
E |
X |
||||||||||||||||||||||
▲ CORA Service Area: Scattered Sites Population: DV Survivors |
X |
X |
T/E |
||||||||||||||||||||||||
Bay Area Legal AID |
X |
||||||||||||||||||||||||||
HIP Housing |
X |
X |
|||||||||||||||||||||||||
Family Harvest Population: Families with Minors Days of Service: 3rd F Hours: 5:00 pm - 7:00 pm |
X |
||||||||||||||||||||||||||
Seniors at Home Population: Seniors |
X |
||||||||||||||||||||||||||
Women’s Recovery Association Population: Women |
X |
||||||||||||||||||||||||||
San Mateo |
|||||||||||||||||||||||||||
San Mateo County Mental Health Services |
X |
X |
X |
||||||||||||||||||||||||
Samaritan Family Kitchen Population: All |
X |
||||||||||||||||||||||||||
Samaritan House Dining Room (Westside Church of Christ) Population: All |
X |
||||||||||||||||||||||||||
St. Vincent de Paul Society Population: All Days of Services: M-F Hours: 10:00 am - Noon |
X |
X |
X |
X |
X | ||||||||||||||||||||||
JACL Japanese Community Center |
X |
X |
X |
X |
|||||||||||||||||||||||
San Mateo City Parks and Recreation Department Population: Seniors |
X |
X |
|||||||||||||||||||||||||
Ellipse |
X |
||||||||||||||||||||||||||
San Mateo Senior Center Population: Seniors |
X |
X |
X |
X |
|||||||||||||||||||||||
Self-Help for the Elderly/ San Mateo Center Population: Seniors |
X |
X |
|||||||||||||||||||||||||
South San Francisco |
|||||||||||||||||||||||||||
Sitike Counseling Center Population: Men and Woman |
X |
||||||||||||||||||||||||||
South San Francisco |
|||||||||||||||||||||||||||
● North Peninsula Neighborhood Services Center Service Area: South San Francisco, San Bruno, Brisbane Days of Service: M-F Hours: 8:30 - 5:00 pm |
X |
X |
X |
X |
X |
X |
X |
X | |||||||||||||||||||
▲ Safe Harbor Shelter – Samaritan House Population: Single Adults Day of Service: Daily Hours: 5:30 pm - 7:00 am |
X |
X |
X |
X |
X |
X |
T/E |
||||||||||||||||||||
South San Francisco Senior Services/ El Camino Senior Center Population: Seniors |
X |
X |
X |
X |
X |
||||||||||||||||||||||
St. Vincent de Paul Drop-in Assistance Days of Service: M-F Hours: 10 am - 12 Noon Population: All |
X |
X |
X |
X |
X | ||||||||||||||||||||||
Café St. Vincent Population: All Hours and Days of Service: M-F 10:00 am to Noon; Sat 10:00 - 11:00 am |
X |
X |
|||||||||||||||||||||||||
SMC Health – Mobile Health Van |
X |
X |
X |
||||||||||||||||||||||||
South San Francisco |
|||||||||||||||||||||||||||
El Camino Senior Center Population: Seniors 60+ Days of Food Service: T-Th-F Hours: Noon |
X |
X |
X |
||||||||||||||||||||||||
Family Harvest Population: Families with Minors Days of Food Services: 4th Wednesdays (Monthly) Hours: 1:00 - 2:00 pm |
X |
X |
|||||||||||||||||||||||||
Grace Covenant Church Population: Seniors 55+ and all days of Food Service: 1st and 3rd Sat. |
X |
||||||||||||||||||||||||||
Salvation Army Population: All Days of Services: Saturdays Hours: 10:30 am - 11:30 AM sign-up |
X |
X |
|||||||||||||||||||||||||
Magnolia Senior Center Population: Seniors 60+ Hours and Days of Meal Services: W & F at Noon; Saturdays at 10:30 AM |
X |
X |
X |
X |
|||||||||||||||||||||||
Appendix B: Copy of the Shelter and Safety Net Survey
List of Participating Service Providers:
1. Samaritan House
2. El Concilio of San Mateo County
3. North Peninsula Neighborhood Services Center, Inc.
4. City of Redwood City/Fair Oaks Community Center
5. Daly City Community Services Center
6. Pacifica Resource Center
7. Communities Overcoming Relationship Abuse (CORA)
8. Coastside Hope
9. Safe Harbor Shelter
10. Interfaith Hospitality Network
11. InnVision
12. Shelter Network
13. Bay Area Legal Aid
14. Second Harvest Food Bank of Santa Clara and San Mateo Counties
15. Community Legal Services in East Palo Alto
16. Youth and Family Enrichment Services
17. Legal Aid Society of San Mateo County
18. HIP Housing
Shelter and Safety Net Services Survey
1. Welcome!
The San Mateo County Human Services Agency is currently preparing a report back to the Board of Supervisors on Shelter and Safety
Net Services. In order for us to complete this report back to the Board of Supervisors, we are requesting additional information about
your agency. We have developed a brief survey with a few questions for you to respond to that will assist us with the Board of
Supervisor Report. We would like you to complete the Survey by close of business day on Wednesday, November 5th.
We hope you can take a few minutes to complete the survey we developed. The information that we are collecting from your agency
through this survey is a priority for us and will add much needed value for our report back to the Board of Supervisor. Thank you for
making this a priority and for completing this important survey.
.
Thank you again for your prompt response to the survey.
2. Demographics Information
1. Please provide the following contact information regarding your
agency/organization.
Name:
Company:
Address:
Address 2:
City/Town:
State:
ZIP/Postal Code:
Country:
Email Address:
Phone Number:
2. Select your organization type:
nmlkj
nmlkj
nmlkj
nmlkj
nmlkj
nmlkj
nmlkj
nmlkj
CORE Agency
Emergency Shelter Services
Transitional Shelter Services
Safety Net
Faith-based
Food Distribution
Primary Health
Behavioral Health
Other (please specify)
Page 1
Shelter and Safety Net Services Survey
3. What is the annual operating budget of your organization?
4. What are your organization's sources of funding for your total budget, by
percentage (ie. government, donations, grants, fees)?
3. Agreements with Human Services Agency
* 1. Do you have a current contract with Human Services Agency for more than one
project and/or service?
nmlkj
nmlkj
Yes
No
2. What program area(s) are you currently in contract with (ie. shelter, safety net
services. child welfare):
1
2
3
4
5
4. Services
1. Please select services available through your organization. (please select all that
apply)
gfedc
gfedc
gfedc
gfedc
gfedc
gfedc
gfedc
gfedc
gfedc
Emergency Food
Emergency Shelter
Transitional Shelter
Clothing
Rental Assistance
Bus passes
Shelter for Individuals
Shelter for Families
Other
Page 2
Shelter and Safety Net Services Survey
2. If rental assistance is provided, please indicate the limit of rental assistance
provided.
* 3. Number of clients served per year? (FY2007-08) Please list for each category,
even if it is duplicated count between categories.
Individuals
Families
Individuals seeking food
assistance
Individuals received food
assistance
Individuals seeking
transitional shelter service
Individuals received
transitional shelter service
Individuals seeking
emergency shelter service
Individuals received
emergency shelter service
* 4. Does your organization provide case management services to individuals/families?
nmlkj
nmlkj
Yes
No
5. If case management is provided, what is the average length of time case
management is provided.
nmlkj
nmlkj
nmlkj
nmlkj
nmlkj
Less than 30 days
1-3 months
3-6 months
6-9 months
Over 9 months
5. Client Profile
Page 3
Shelter and Safety Net Services Survey
1. Please enter the percentage of clients served per year, by category
(approximately):
Homeless Youth (Under
17 years)
Homeless Adults
Homeless Families
Chronically Homeless
Permanetly Disabled
Employed
Unemployed
6. Referrals
1. Where do you send Individuals when in need of emergency shelter services?
First Option
Second Option
Third Option
Fourth Option
2. When shelters have reached capacity, please provide alternative shelter referrals
for Individuals.
First Option
Second Option
Third Option
Fourth Option
3. Where do you send Families in need of emergency shelter services?
First Option
Second Option
Third Option
Fourth Option
4. When shelters have reached capacity, please provide alternative shelter referrals
for Families.
First Option
Second Option
Third Option
Fourth Option
Page 4
Shelter and Safety Net Services Survey
5. If you provide shelter services, where do the clients go during the day when they
cannot stay at the shelter?
First Option
Second Option
Third Option
Fourth Option
6. If you provide shelter services where clients can stay during the day, please
provide the reason why they stay at the shelter and what services they receive
during the day:
7. If you provide day services at the shelter, please provide the average number of
clients that stay during the day for those services.
7. Thank you for taking the time to participate.
Your feedback and information is highly important to us!
1. Additional Comments:
Page 5
Appendix C: Prototype of the Handout to be Distributed at Homeless Census 2009
Please refer to the separate .pdf file entitled “Appendix C” to view a prototype and description of the two items that will be distributed at the Homeless Census to commence in January 2009:
• The first item is a pocket sized handout with resource information
• The second item is a mylar survival wrap
1 Vernez, Georges. California. Department of Mental Health. Review of California's Program for the Homeless Mentally Disabled. Santa Monica, CA: The RAND Corporation, 1988. pg. 16