 2009-10 Workforce & Succession Planning Report
County Diversity Profile
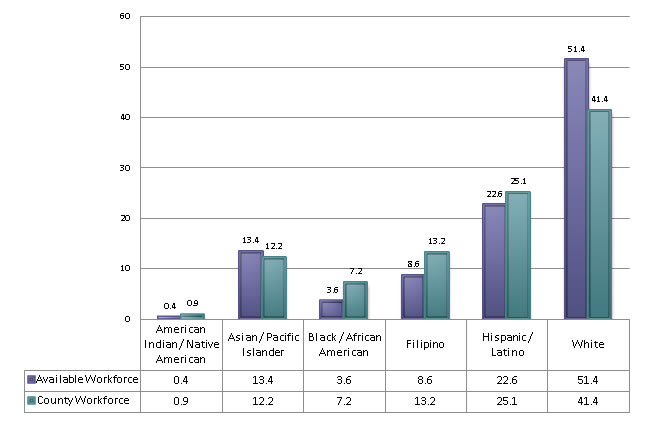
Available Community Workforce compared to 2010 County Workforce
|
|
Available Workforce |
County Workforce |
American Indian / Native American |
0.4 |
0.9 |
Asian / Pacific Islander |
13.4 |
12 |
Black / African American |
3.6 |
7.2 |
Filipino |
8.6 |
13 |
Hispanic / Latino |
22.6 |
25 |
White |
51.4 |
41 |
***reporting is voluntary
Countywide – Noteworthy Diversity Demographic Information
Overall, San Mateo County has exceptional race diversity that likely ranks the County in the top 1% of all employers (public or private) in terms of matching our diversity to the diversity of the identified local workforce at large. Much of this information is contained in the 2010-2013 EEO Plan accepted by the Board of Supervisors on December 1, 2009.
This information is based on the County’s current data compared to the 2000 U.S. Census. The 2010 census data should be available for use with next year’s workforce reports. This information will help identify population and workforce trends that have developed in the past ten years and apply those lessons to the County's workforce planning.
Diversity of Management Classifications
An employer’s diversity can be measured by how well it compares to the overall workforce at large in its management positions. As illustrated in the chart below, San Mateo County excels in this measure of diversity.
|
|||
Race |
Workforce at large |
San Mateo County |
County Differential |
American Indian |
0.1% |
0.2% |
0.1% |
Asian |
10.6% |
7.2% |
-3.4% |
Black |
1.3% |
2.5% |
1.2% |
Latino |
4.5% |
3.5% |
-1.0% |
Caucasian |
40.9% |
33.5% |
-7.4% |
Female |
|||
Race |
Workforce at large |
San Mateo County |
County Differential |
American Indian |
0.1% |
0.2% |
0.1% |
Asian |
8.1% |
8.3% |
0.2% |
Black |
1.1% |
3.7% |
2.6% |
Latino |
4.6% |
7.0% |
2.4% |
Caucasian |
25.5% |
33.5% |
8.0% |
Notations
The federal government includes Filipinos in the Asians category for this report.
A positive differential means we are over-represented, and a negative differential means we are under-represented. Differentials of less than 5% are likely considered within an acceptable range.
Data excludes Attorney positions.