 2009-10 Workforce & Succession Planning Report
Management vs Non Management
Click to enlarge
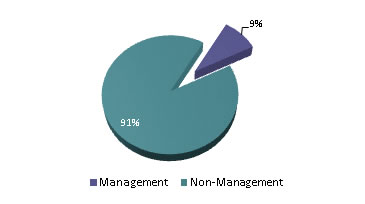
The chart to the right shows the number of management positions as a percentage of the County’s total workforce. Management positions are differentiated from non-management positions for having duties requiring the formulation and determination or capacity to influence the policies, programs and/or overall direction of the organization. This data is useful in determining span-of-control ratios.
|
|
Countywide |
Management |
9% |
Non-Management |
91% |
Management vs Non Management by Department*
|
FY 2006-07 |
FY 2007-08 |
FY 2008-09 |
FY 2009-10 |
||||
Positions |
% Mgmt |
Positions |
% Mgmt |
Positions |
% Mgmt |
Positions |
% Mgmt |
|
Assessor/County Clerk/Recorder |
123 |
11% |
123 |
11% |
121 |
9% |
113 |
9% |
Board of Supervisors |
20 |
100% |
20 |
100% |
20 |
100% |
20 |
100% |
Child Support Services |
103 |
7% |
98 |
6% |
98 |
6% |
92 |
5% |
CMO County Manager's Office** |
29 |
59% |
102 |
29% |
102 |
29% |
98 |
33% |
Controller's Office |
41 |
17% |
44 |
20% |
44 |
20% |
45 |
22% |
Coroner's Office |
15 |
20% |
15 |
20% |
15 |
20% |
15 |
20% |
County Counsel's Office |
41 |
17% |
41 |
17% |
40 |
18% |
40 |
18% |
County Library |
128 |
13% |
128 |
13% |
128 |
13% |
130 |
14% |
Department of Housing |
19 |
26% |
19 |
32% |
19 |
32% |
14 |
36% |
District Attorney's Office |
128 |
9% |
130 |
8% |
129 |
8% |
129 |
8% |
Employee and Public Services |
140 |
27% |
-- |
-- |
-- |
-- |
-- |
-- |
Environmental Services Admin |
3 |
67% |
-- |
-- |
-- |
-- |
-- |
-- |
First 5 SMC |
12 |
33% |
12 |
33% |
12 |
33% |
12 |
33% |
Health System |
2,245 |
6% |
2,384 |
6% |
2,442 |
6% |
2,288 |
7% |
Human Resources Department |
-- |
-- |
57 |
49% |
56 |
50% |
55 |
55% |
Human Services Agency |
833 |
6% |
876 |
6% |
858 |
6% |
778 |
6% |
Information Services Department |
139 |
9% |
154 |
10% |
154 |
10% |
156 |
10% |
LAFCo |
1 |
100% |
1 |
100% |
1 |
100% |
1 |
100% |
Parks Department*** |
61 |
7% |
61 |
8% |
61 |
8% |
57 |
9% |
Planning and Building |
55 |
13% |
56 |
14% |
55 |
16% |
52 |
15% |
Probation Department |
468 |
12% |
466 |
12% |
463 |
12% |
427 |
11% |
Public Works |
324 |
8% |
329 |
9% |
335 |
10% |
317 |
11% |
Retirement Office |
14 |
43% |
16 |
38% |
16 |
38% |
16 |
38% |
Sheriff's Office |
623 |
6% |
635 |
6% |
645 |
6% |
623 |
6% |
Tax Collector - Treasurer |
63 |
11% |
63 |
13% |
65 |
12% |
63 |
13% |
Total |
5,628 |
9% |
5,830 |
9% |
5,879 |
9% |
5,541 |
9% |
*Information based on Master Salary Ordinance; FY 2009-10 reflects mid-year Salary Ordinance
** Beginning in 2007 CMO data includes PSC
*** Parks includes Coyote Point