 2009-10 Workforce & Succession Planning Report
Retirement Risk
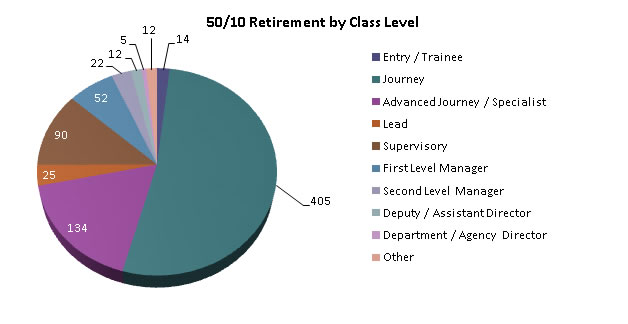
Countywide there are 1,130 employees that are eligible to retire. Of those 771 are in the 55/10 category and 359 are in the 55/20 category. This represents about 20% of filled positions. The chart(s) and table(s) below reflect retirement risks Countywide by Class Level.
50/10 Retirement Risk
by Classification Level
Entry / Trainee |
14 |
Journey |
405 |
Advanced Journey / Specialist |
134 |
Lead |
25 |
Supervisory |
90 |
First Level Manager |
52 |
Second Level Manager |
22 |
Deputy / Assistant Director |
12 |
Department / Agency Director |
5 |
Other |
12 |
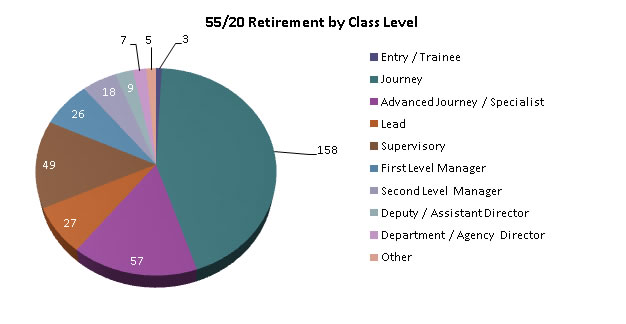
55/20 Retirement Risk
by Classification Level
Entry / Trainee |
3 |
Journey |
158 |
Advanced Journey / Specialist |
57 |
Lead |
27 |
Supervisory |
49 |
First Level Manager |
26 |
Second Level Manager |
18 |
Deputy / Assistant Director |
9 |
Department / Agency Director |
7 |
Other |
5 |
Retirement Risk by Department
|
FY 2006-07 |
FY 2007-08 |
FY 2008-09 |
FY 2009-10 |
|||||||
|
50/ |
55/ |
50/ |
55/ |
50/ |
55/ |
50/ |
55/ |
Total |
Filled Positions |
% of Workforce |
Assessor / County Clerk/ Recorder |
16 |
24 |
19 |
16 |
20 |
16 |
14 |
17 |
31 |
103 |
30% |
Board of Supervisors |
1 |
|
1 |
0 |
3 |
0 |
3 |
0 |
3 |
19 |
16% |
Child Support Services |
5 |
3 |
4 |
2 |
5 |
2 |
5 |
3 |
8 |
89 |
9% |
CMO Ag Weights & Measures* |
-- |
-- |
-- |
-- |
-- |
-- |
11 |
3 |
14 |
29 |
48% |
CMO County |
5 |
5 |
8 |
6 |
5 |
7 |
7 |
6 |
13 |
36 |
36% |
CMO Public Safety Communications |
3 |
0 |
4 |
0 |
8 |
0 |
9 |
0 |
9 |
54 |
17% |
Controller's Office |
5 |
6 |
8 |
4 |
8 |
4 |
5 |
4 |
9 |
39 |
23% |
Coroner's Office |
1 |
0 |
2 |
0 |
2 |
0 |
3 |
0 |
3 |
14 |
21% |
County Counsel's Office |
6 |
5 |
5 |
4 |
5 |
4 |
6 |
2 |
8 |
37 |
22% |
County Library |
20 |
14 |
19 |
11 |
18 |
9 |
18 |
10 |
28 |
122 |
23% |
Department of Housing |
3 |
2 |
4 |
2 |
5 |
1 |
6 |
0 |
6 |
17 |
35% |
District Attorney's Office |
11 |
5 |
9 |
7 |
9 |
10 |
16 |
11 |
27 |
122 |
22% |
First 5 SMC |
0 |
0 |
0 |
0 |
0 |
0 |
1 |
0 |
1 |
11 |
9% |
Health System |
260 |
93 |
281 |
95 |
301 |
106 |
298 |
117 |
415 |
2107 |
20% |
Human Resources Department |
9 |
2 |
8 |
0 |
9 |
0 |
7 |
1 |
8 |
50 |
16% |
Human Services Agency |
96 |
56 |
89 |
49 |
90 |
56 |
92 |
50 |
142 |
703 |
20% |
Information Services Department |
15 |
7 |
21 |
8 |
25 |
10 |
23 |
10 |
33 |
145 |
23% |
Parks Department** |
10 |
9 |
10 |
9 |
9 |
8 |
9 |
8 |
17 |
53 |
33% |
Planning and Building Department |
7 |
7 |
6 |
5 |
4 |
7 |
5 |
8 |
13 |
48 |
27% |
Probation Department |
27 |
20 |
31 |
18 |
34 |
19 |
35 |
13 |
48 |
424 |
11% |
Public Works |
35 |
25 |
42 |
26 |
37 |
23 |
50 |
20 |
70 |
273 |
26% |
Retirement Office |
2 |
0 |
2 |
0 |
1 |
1 |
1 |
1 |
2 |
15 |
13% |
Sheriff's Office |
73 |
25 |
72 |
31 |
73 |
32 |
70 |
34 |
104 |
582 |
18% |
Tax Collector - Treasurer |
10 |
6 |
11 |
8 |
12 |
8 |
14 |
8 |
22 |
60 |
37% |
Subtotal |
620 |
314 |
656 |
301 |
684 |
323 |
709 |
326 |
1,035 |
5,153 |
20% |
Superior Court |
56 |
36 |
56 |
28 |
60 |
33 |
62 |
33 |
95 |
338 |
28% |
Total |
676 |
350 |
712 |
329 |
744 |
356 |
771 |
359 |
1,130 |
5,491 |
21% |
* Ag Weights and Measures historical data reflected under Health System
** Parks Department data includes Coyote Point