 2009-10 Workforce & Succession Planning Report
Workforce at a glance
2006-07 |
2007-08 |
2008-09 |
2009-10 |
|
Hire and Deploy |
||||
Authorized Positions |
6,158 |
6,313 |
6,295 |
5,938 |
New Hires |
544 |
497 |
275 |
154 |
Vacancies |
509 |
675 |
631 |
447 |
Extra Help/Temporary Usage |
-- |
-- |
-- |
1,000 |
Average Age* |
45 |
45 |
46 |
45 |
Recruitments Conducted |
469 |
446 |
266 |
171 |
Applications Received |
13,505 |
13,550 |
12,803 |
9,365 |
Engage and Retain |
||||
Classifications Studies |
40 |
56 |
186 |
94 |
# of Employees on LOA |
662 |
655 |
566 |
692 |
# of Employees on VTO |
-- |
-- |
419 |
516 |
Turnover #/% |
532 / 9% |
519 / 8% |
366 / 6% |
318 / 6% |
Employees Eligible to Retire* |
1,026 |
1,041 |
1,100 |
1,130 |
|
676 |
712 |
744 |
771 |
|
350 |
329 |
356 |
359 |
Develop and Prepare |
||||
Promotions |
309 |
460 |
277 |
197 |
Employee Training Taken |
-- |
4,850 |
5,739 |
4,269 |
# of Employees completing 20 hour training requirement |
-- |
1,260 |
1,190 |
986 |
Tuition Reimbursements |
884 |
1,333 |
1,215 |
828 |
Reinforce and Align Performance |
||||
ER Cases Referred |
511 |
571 |
545 |
568 |
Grievances |
39 |
33 |
36 |
74 |
Meet and Confers |
60 |
54 |
73 |
125 |
Sick Leave Used ** |
-- |
-- |
64% |
65% |
Overtime Used (hours) |
-- |
-- |
-- |
395,847 |
EEO Complaints |
72 |
117 |
69 |
95 |
ADA Accommodations |
60 |
63 |
70 |
102 |
TWA (Temporary Work Assignments) |
39 |
46 |
49 |
140 |
Workers’ Comp Claim Average (per 100 Employees) |
14 |
14 |
13 |
13 |
Average # of Lost Days *** |
64 |
98 |
62 |
58 |
Average # of Lost Days **** |
65 |
100 |
65 |
73 |
Average Cost per Claim |
10,123 |
13,903 |
15,858 |
15,888 |
Injuries Reported |
718 |
750 |
679 |
682 |
Auto Claims |
253 |
247 |
287 |
212 |
* As of August 2010
** As of October 2010
***Excludes sworn personnel
****Includes sworn personnel
Click to enlarge
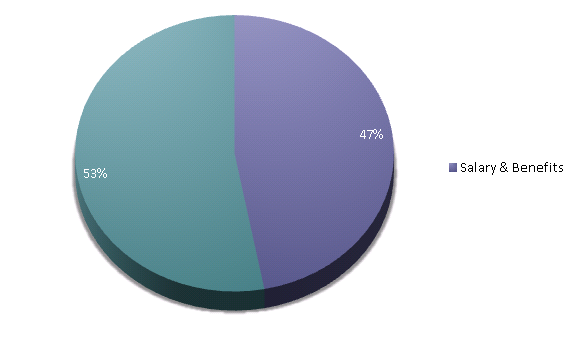
Salary and Benefit Costs as a % of CountyBudget
(Gross Appropriations – All Funds)
Salary & Benefits |
47% |
County Budget |
53% |
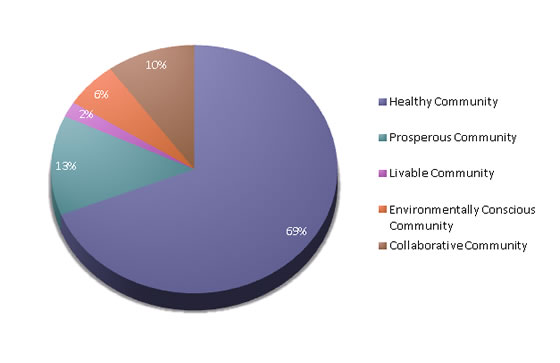
Salary and Benefit Costs by Community Outcome
Click to enlarge
Healthy Community |
69% |
Prosperous Community |
13% |
Livable Community |
2% |
Environmentally Conscious Community |
6% |
Collaborative Community |
10% |
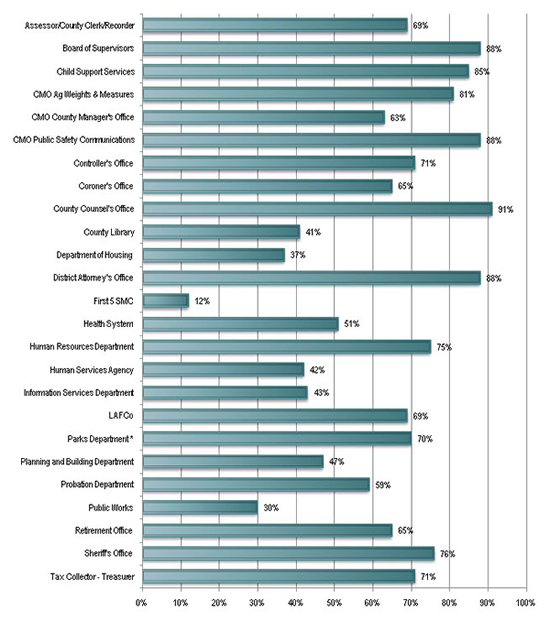
Salary and Benefit Costs as a % of Department Budget (Gross Appropriations)
Click to enlarge
Assessor/County Clerk/Recorder |
69% |
Board of Supervisors |
88% |
Child Support Services |
85% |
CMO Ag Weights & Measures |
81% |
CMO County Manager's Office |
63% |
CMO Public Safety Communications |
88% |
Controller's Office |
71% |
Coroner's Office |
65% |
County Counsel's Office |
91% |
County Library |
41% |
Department of Housing |
37% |
District Attorney's Office |
88% |
First 5 SMC |
12% |
Health System |
51% |
Human Resources Department |
75% |
Human Services Agency |
42% |
Information Services Department |
43% |
LAFCo |
69% |
Parks Department * |
70% |
Planning and Building Department |
47% |
Probation Department |
59% |
Public Works |
30% |
Retirement Office |
65% |
Sheriff's Office |
76% |
Tax Collector - Treasurer |
71% |
* Parks Department data includes Coyote Point